LONDON FASHION WEEK VISUALIZATION (BROWN MSC CAPSTONE)
Worked in collaboration with Holition, Google, Condé Nast, and a select team of students to create an art installation for the London Fashion Week Spring/Summer 2018 event. The visualization shows the emerging conversations (e.g. sustainability, diversity, model health) in the London fashion industry over the course of the two week event.
On the second project for the Capstone, I also led in the research and prototype development of a data forsight research tool for the Holition UX team, used for analyzing trends and conversations from Reddit pertaining to topics like innovation, sustainability, and fashion. Both projects are documented in my Capstone report.
Date: 2018
Client: Holition
Advisor: Dr. Daniel Potter, PhD
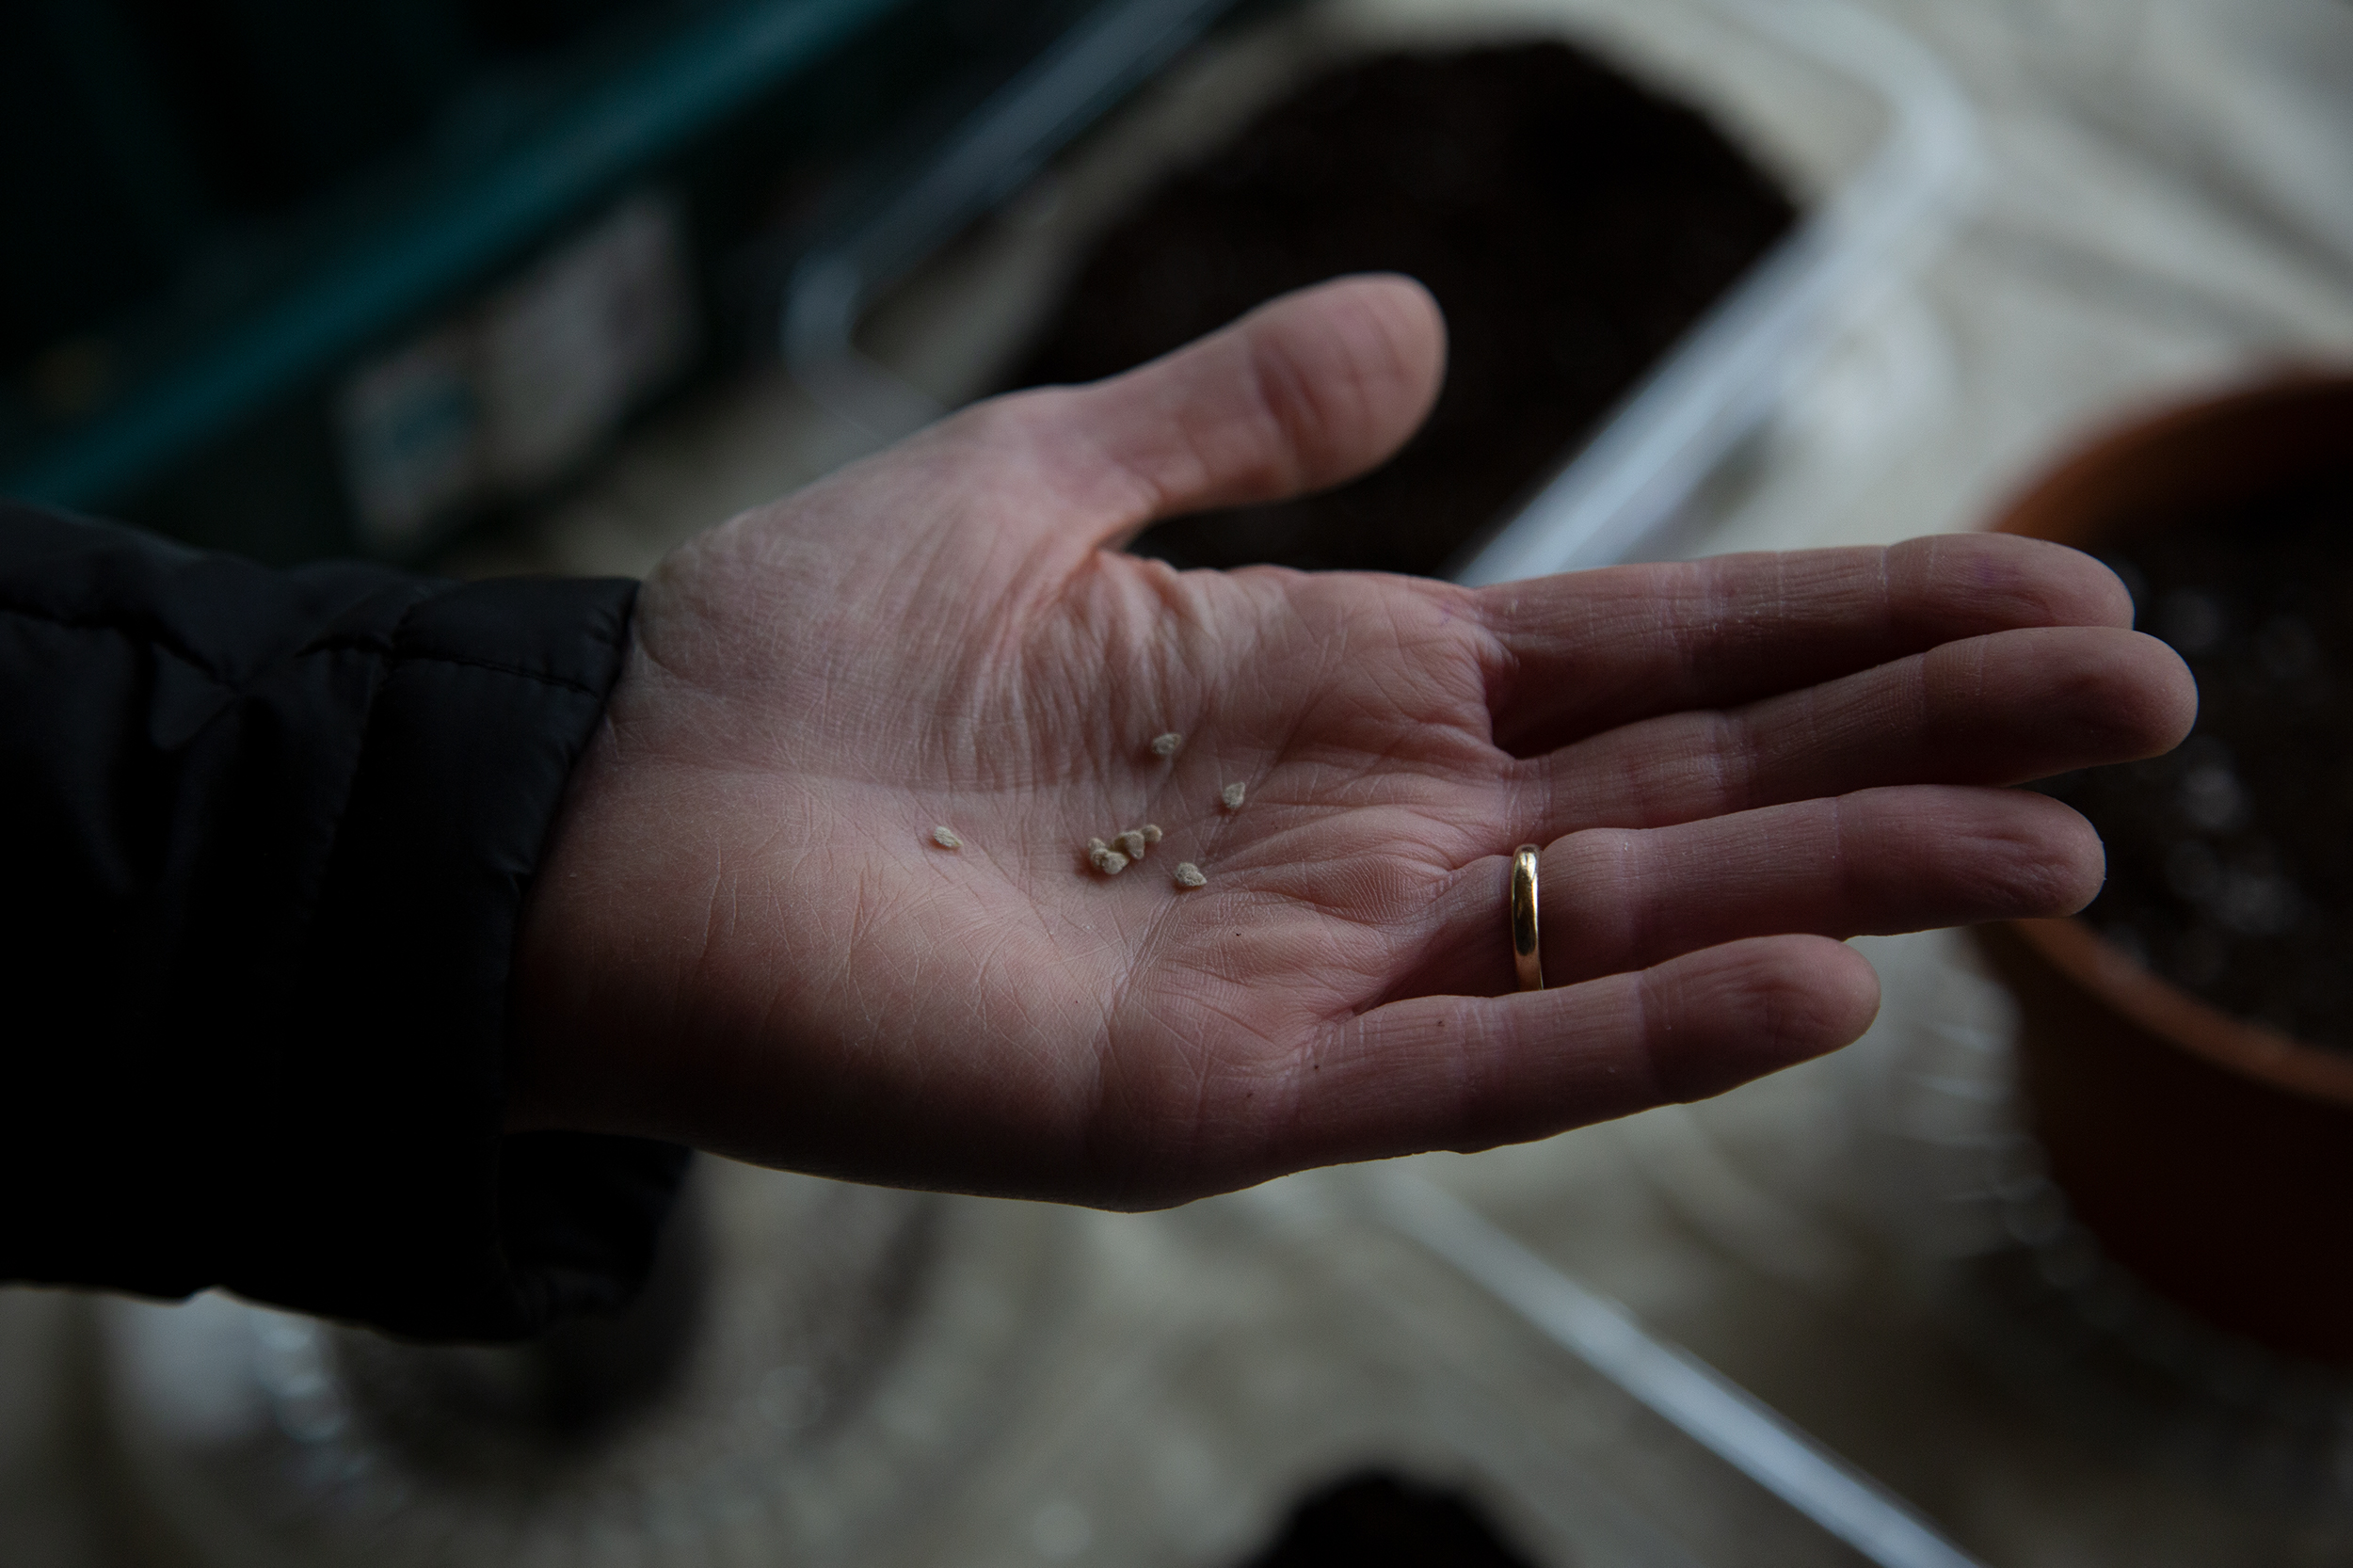
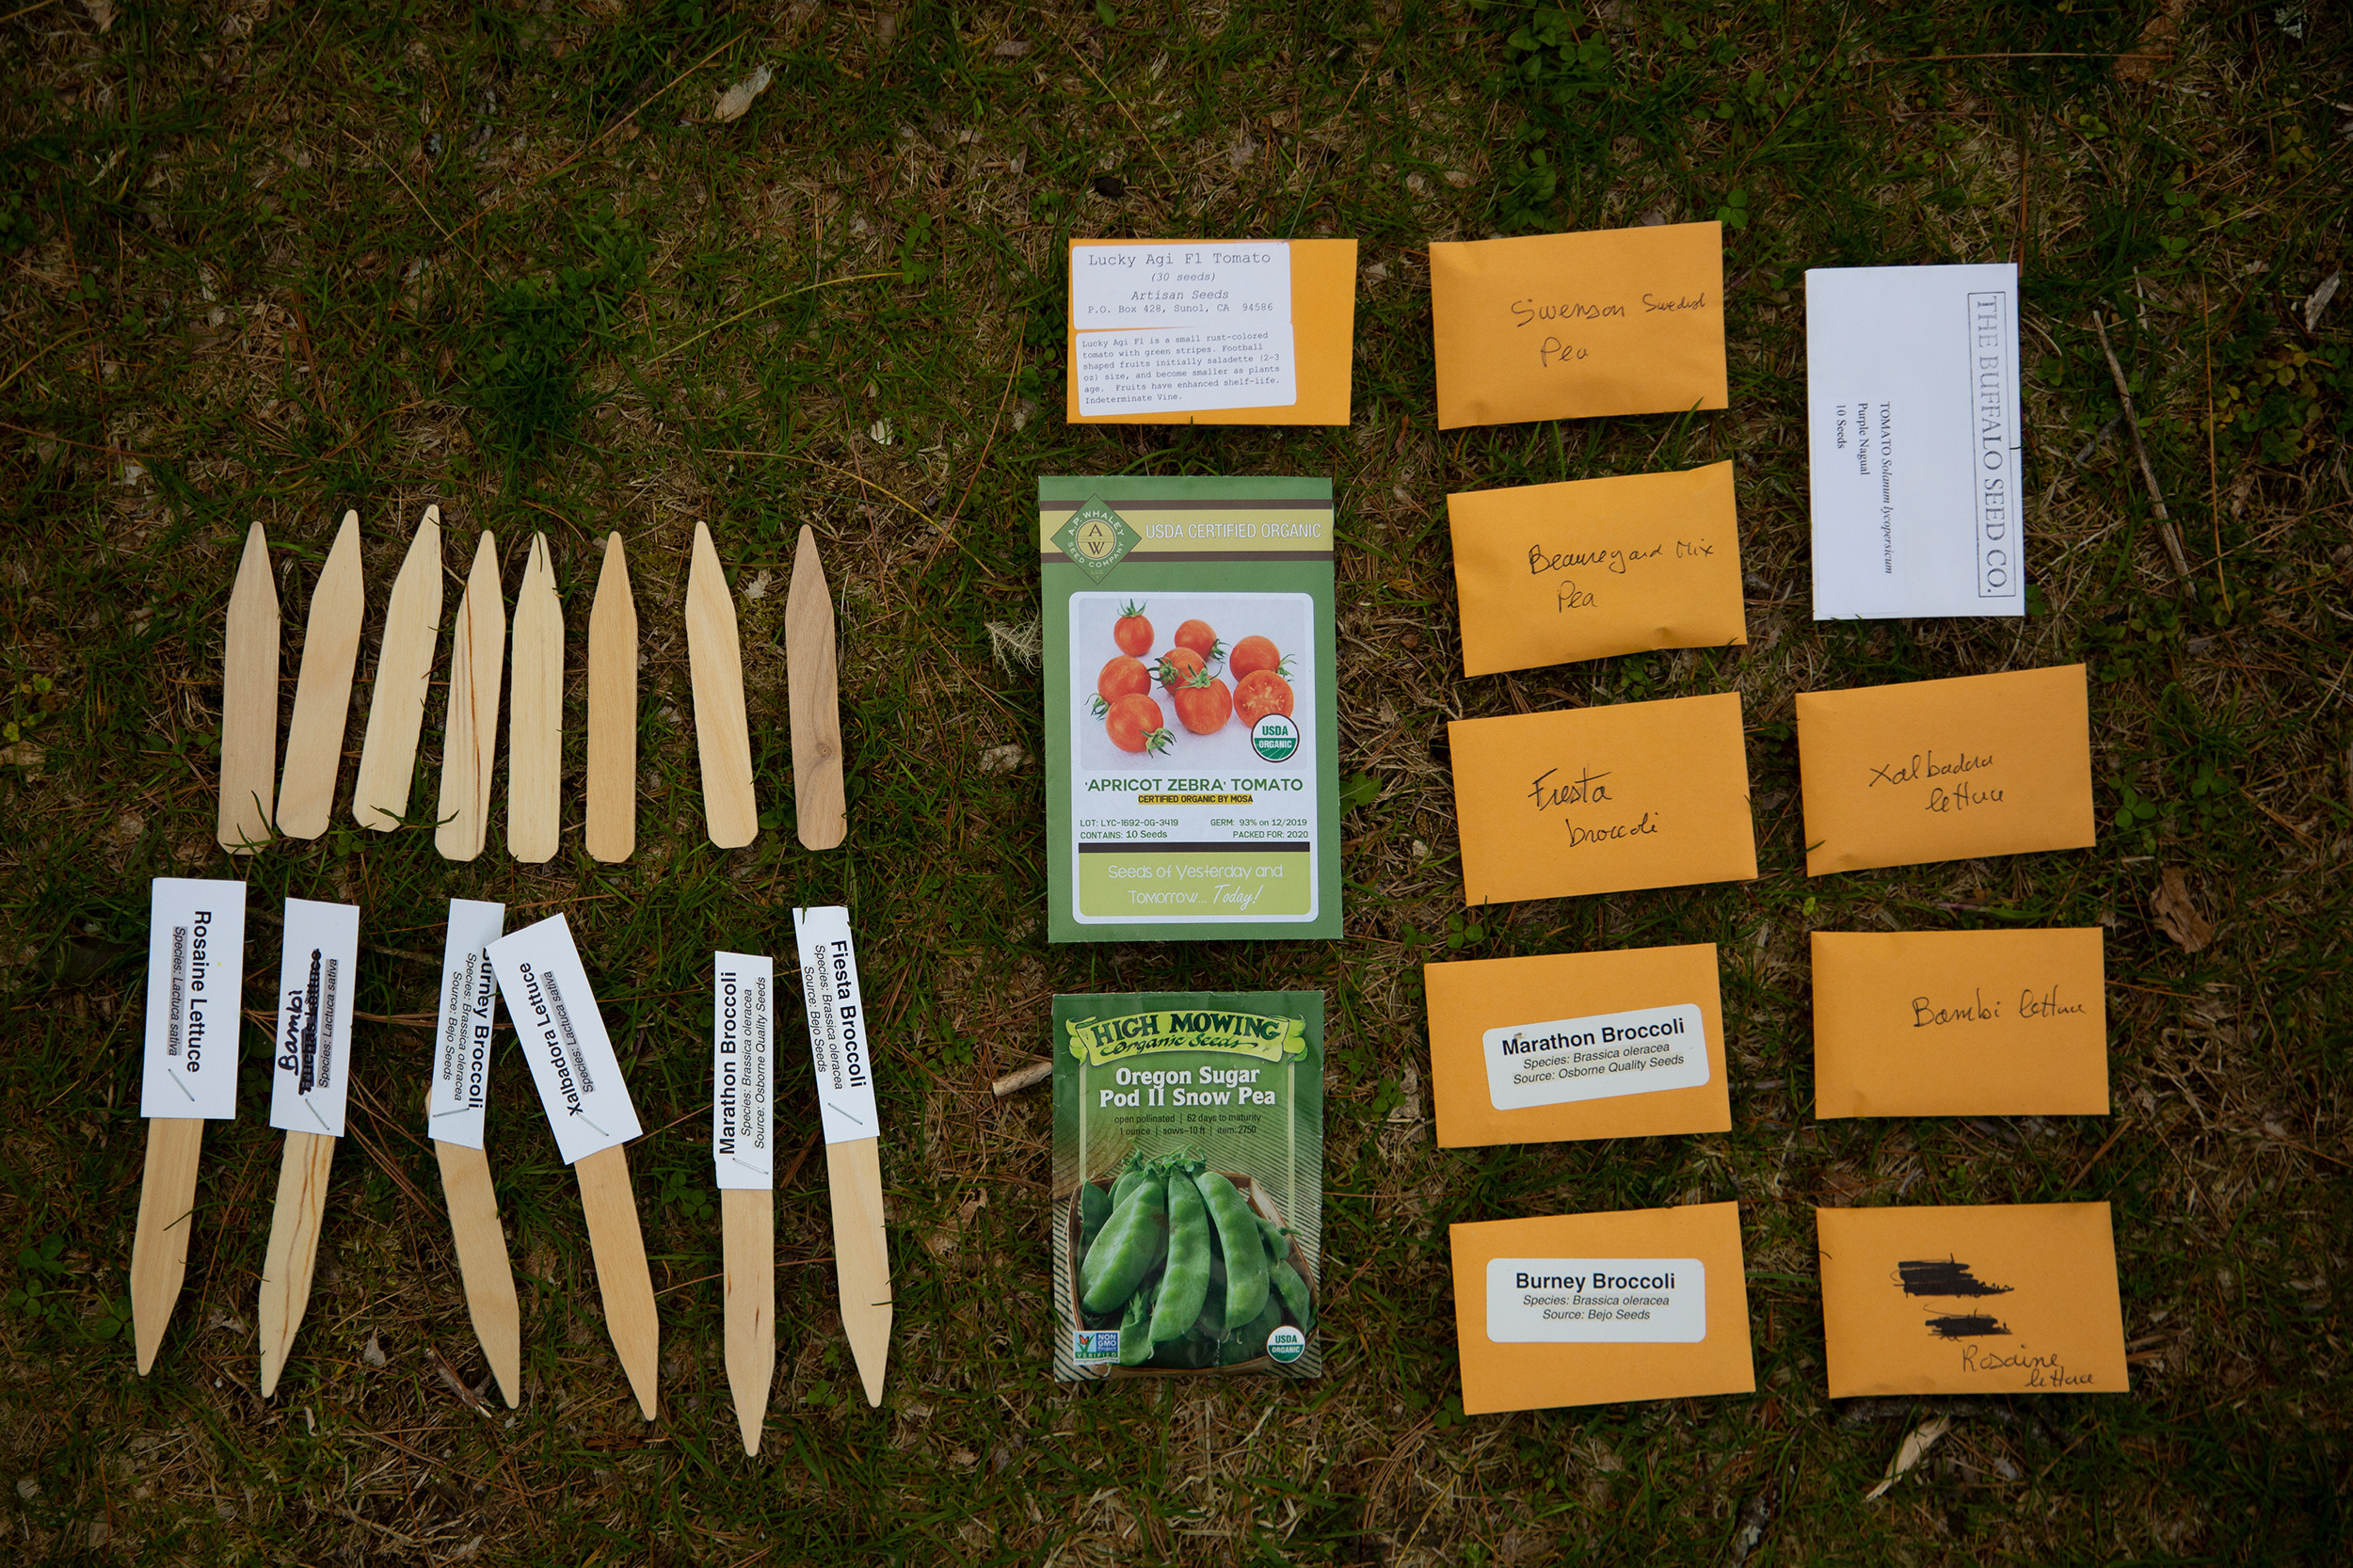
SEEDLINKED: DATA-DRIVEN SEED SHARING
How can we unflatten, juxtapose, and reveal the multiple stakeholder perspectives in the agri-food supply chain to offer a more authentic experience? How can personal stories be used to connect people in the supply chain?
In this report I provide recommendations for the data-driven seed company SeedLinked to help improve the participatory platform and interface design.
Date: 2020
Client: SeedLinked
Class: Foodways & Sustainable Food Systems
Instructor: Jonathan Highfield, PhD

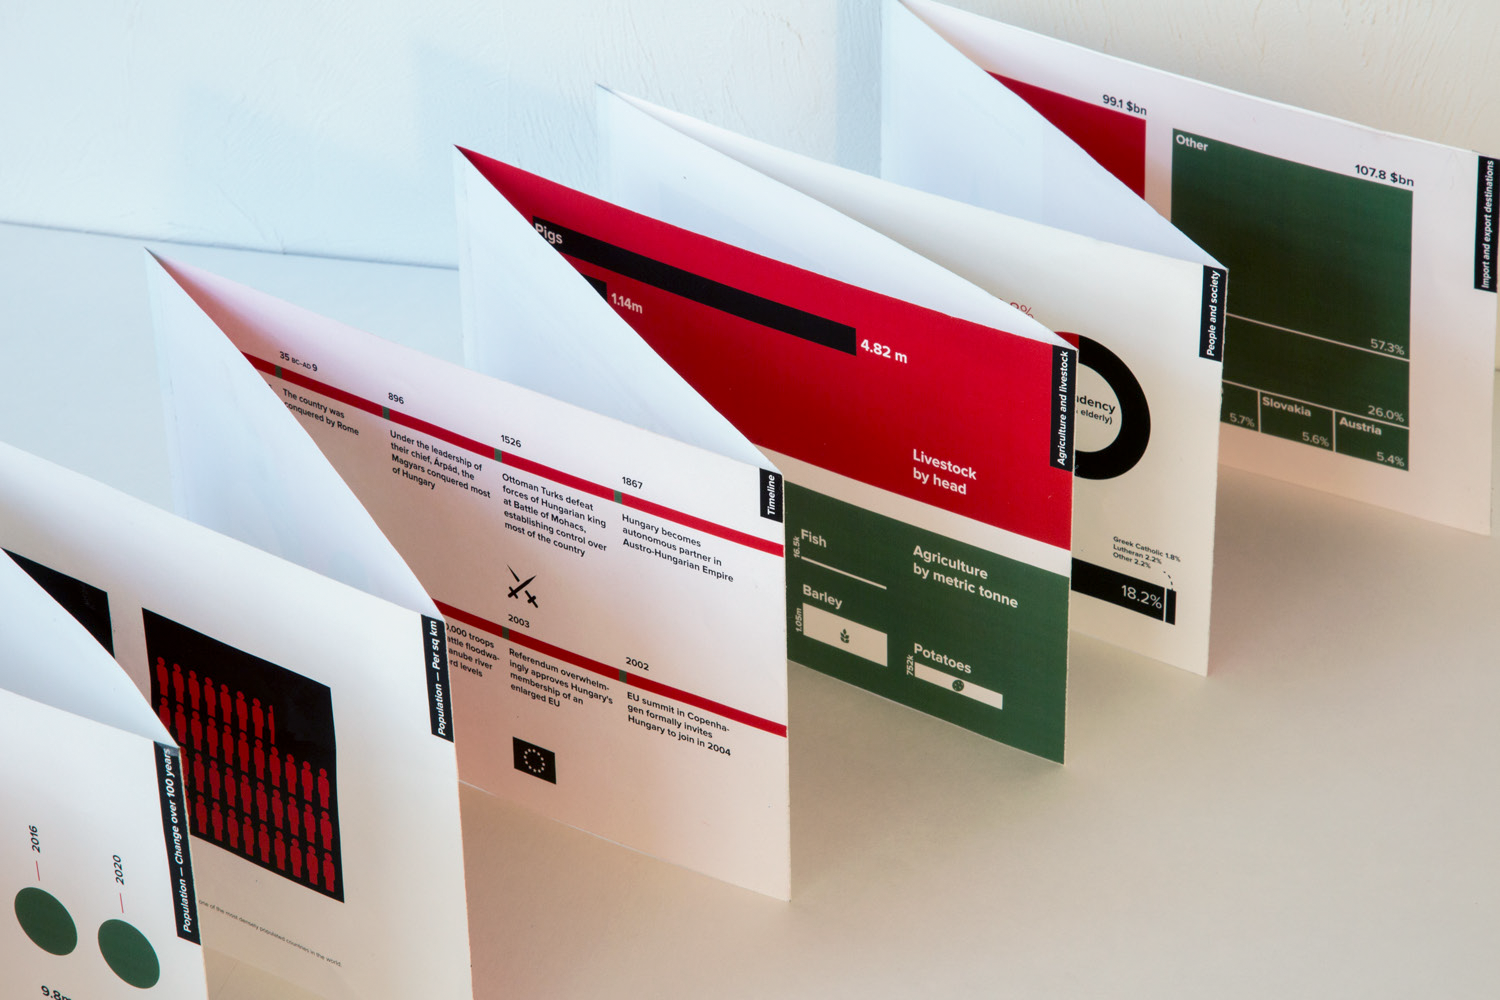
HUNGARY ACCORDION
A visually coherent group of information graphics and statistics about Hungary.
Date: 2016
Client: Self
Class: Information Design (RISD)
Instructor: Doug Scott
A visually coherent group of information graphics and statistics about Hungary.
Date: 2016
Client: Self
Class: Information Design (RISD)
Instructor: Doug Scott
︎Information Design
![]()
![]()
![]()
![]()
![]()
![]()


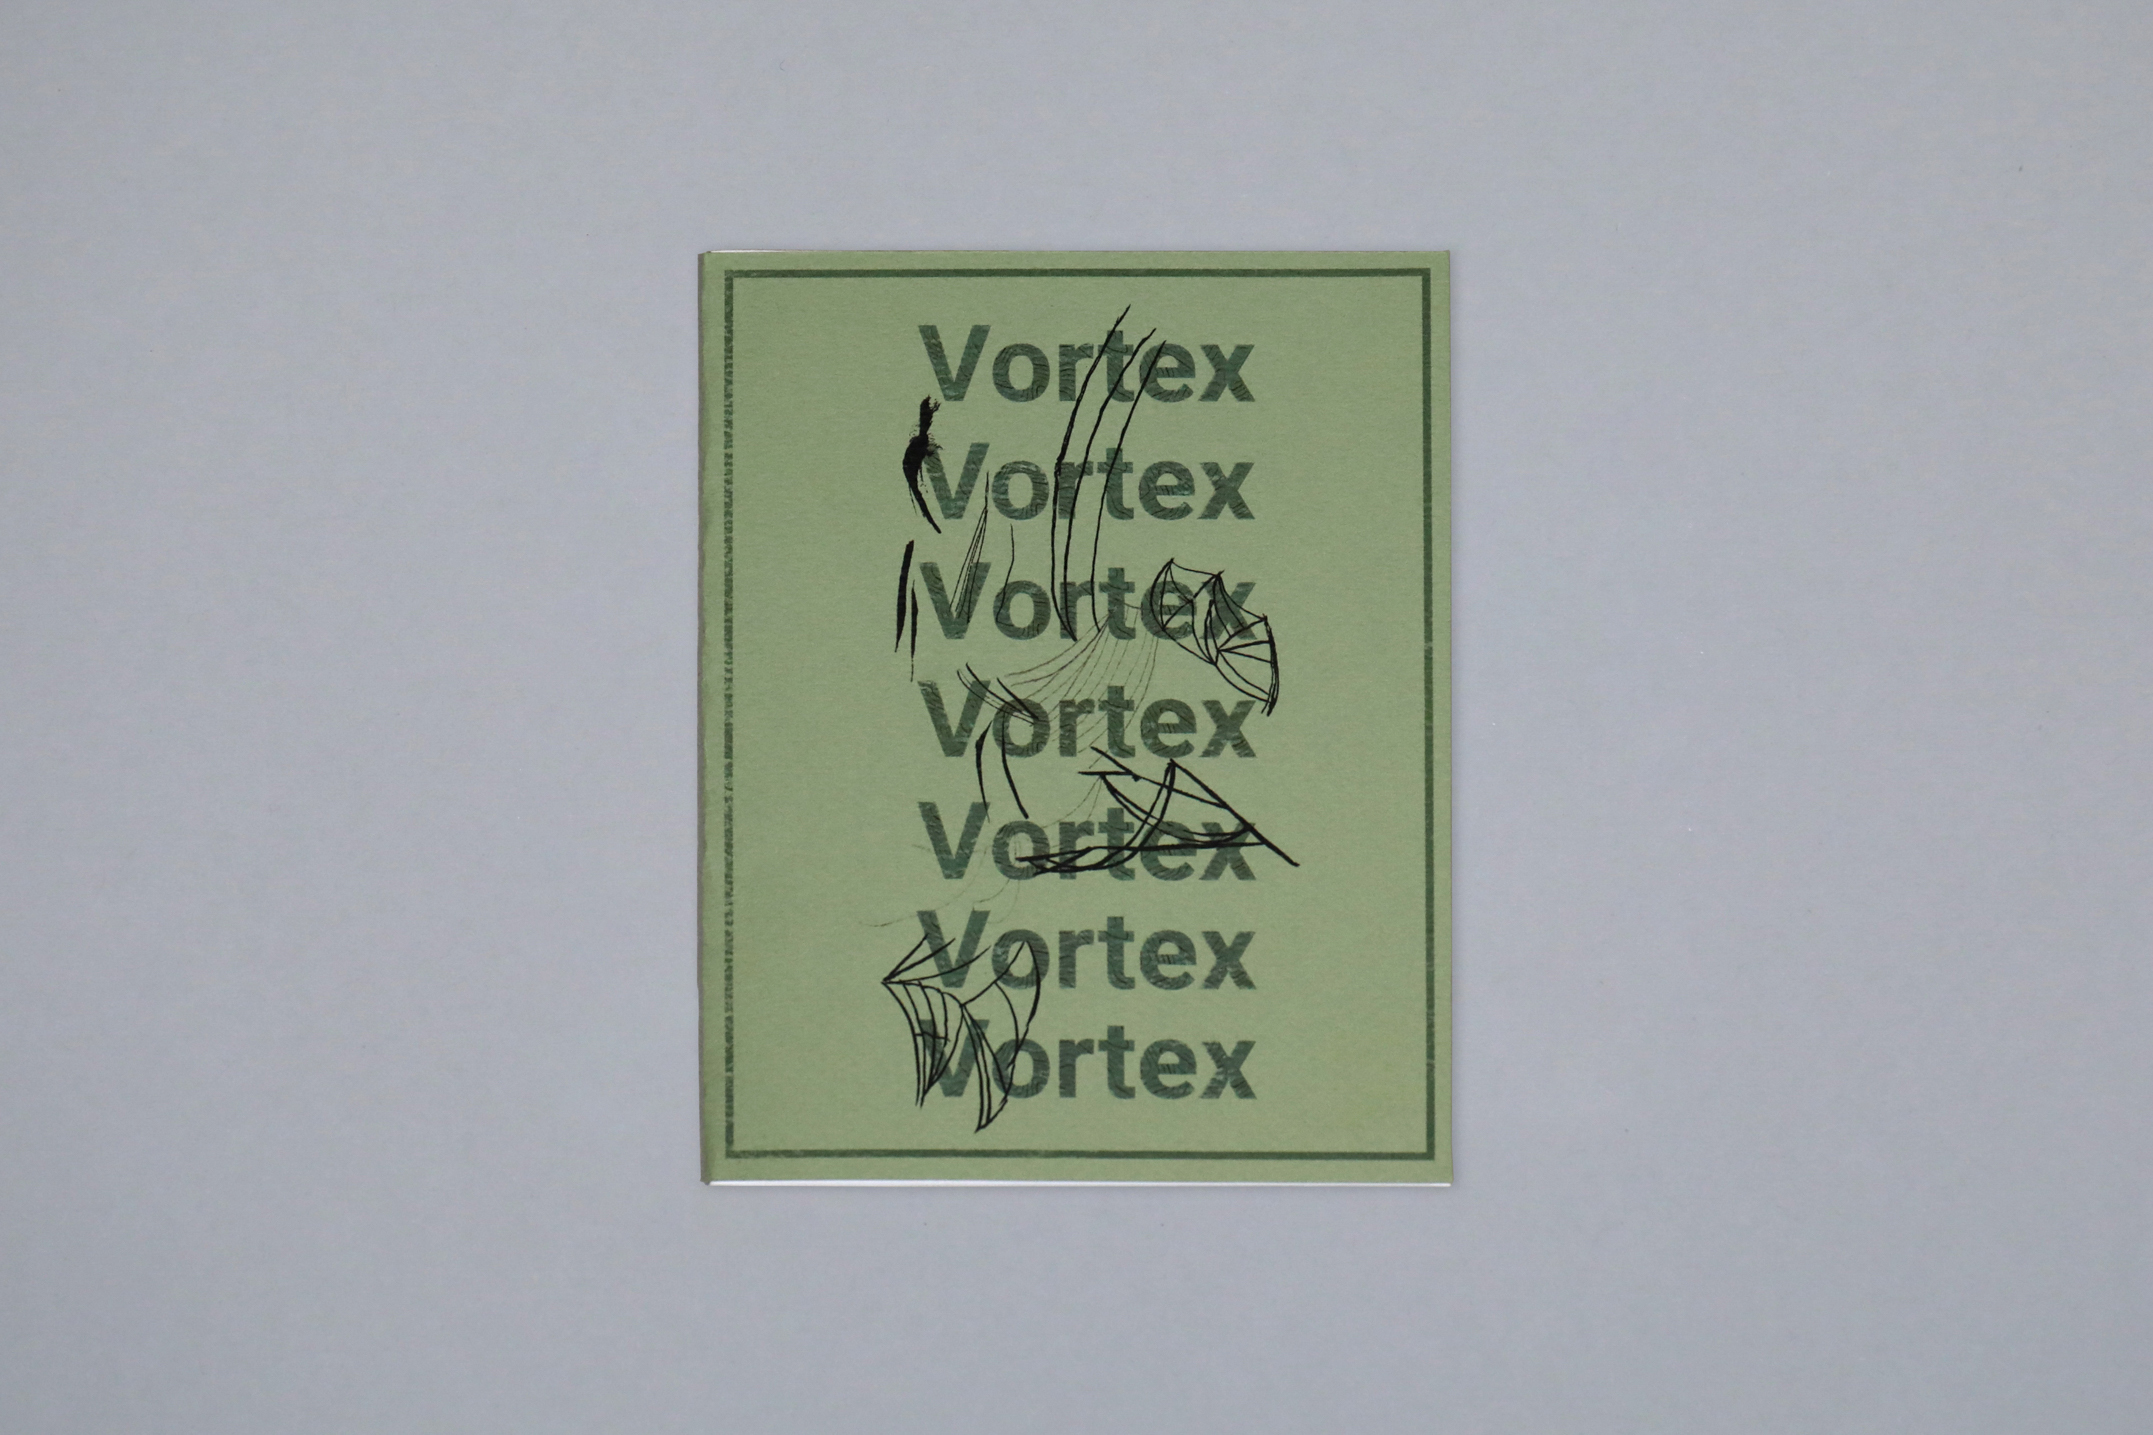
SKETCHY: CREATIVITY SUPPORT TOOL
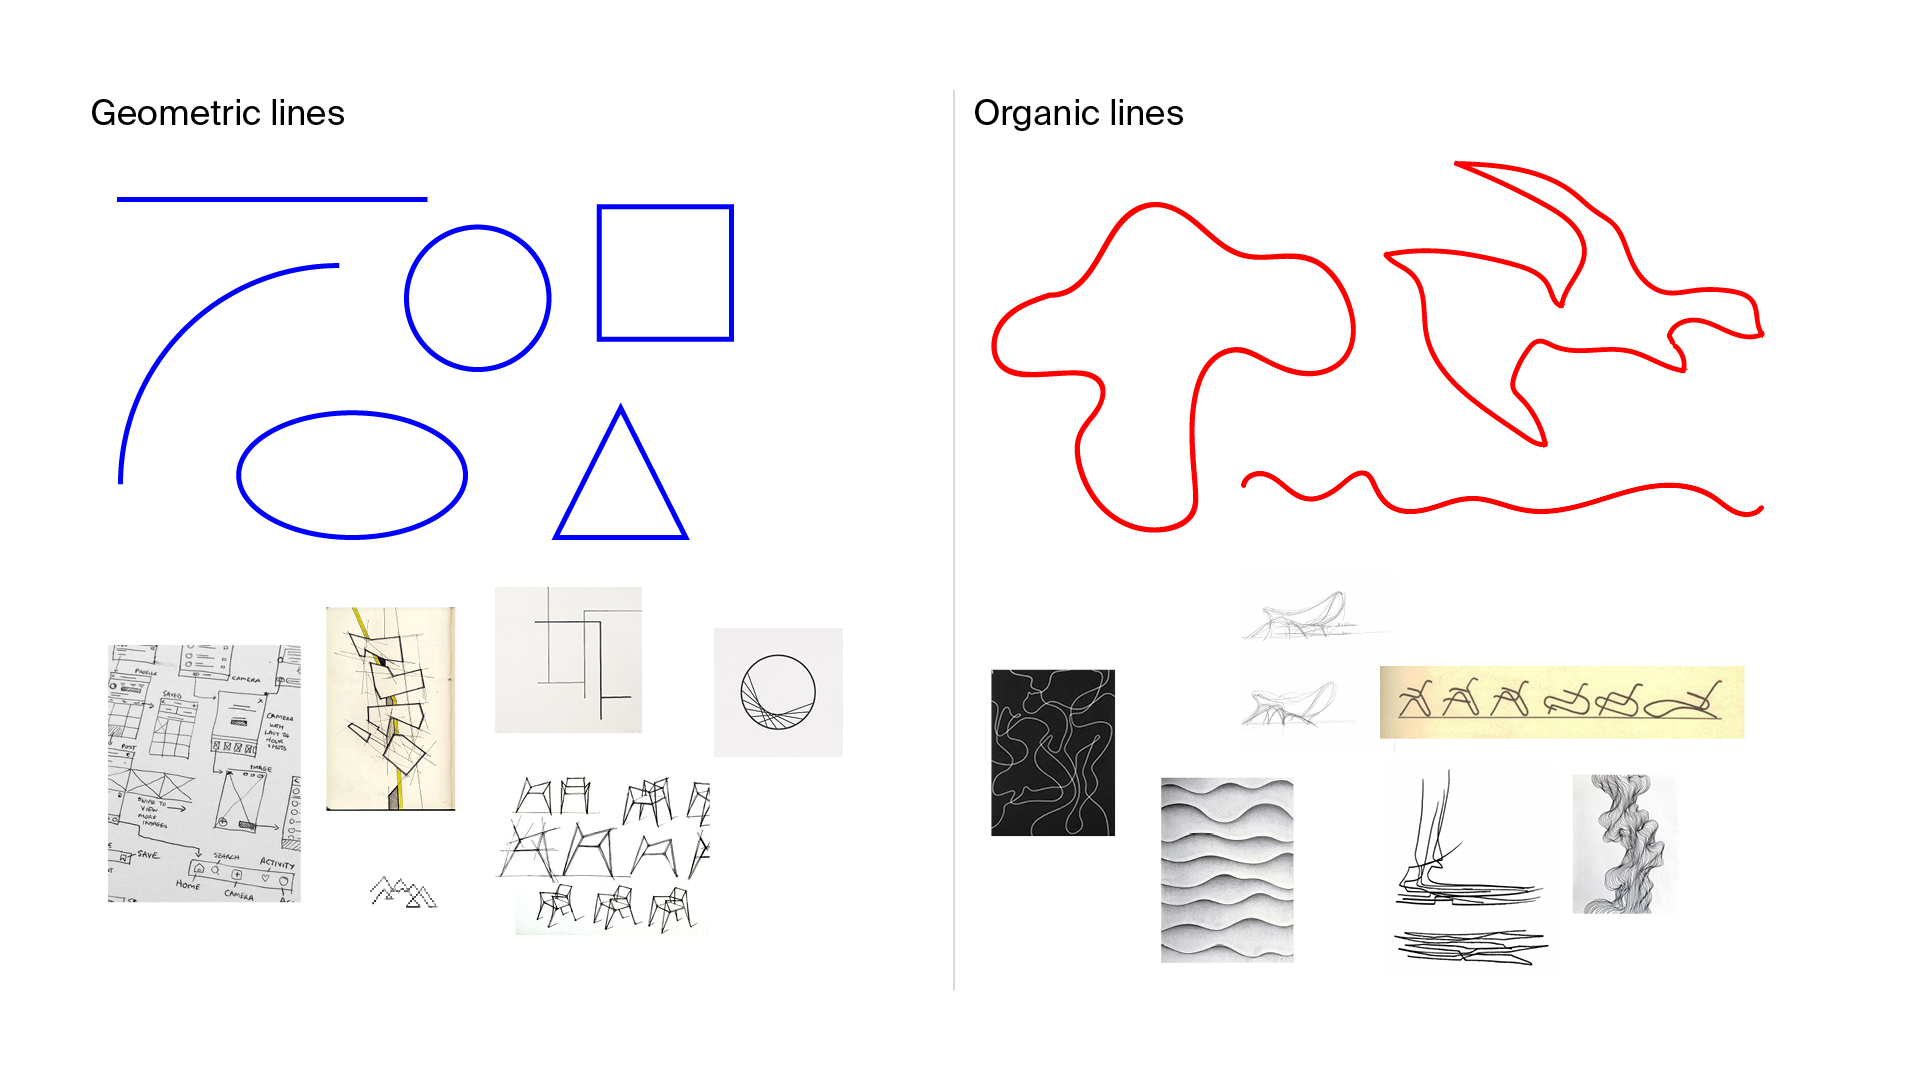
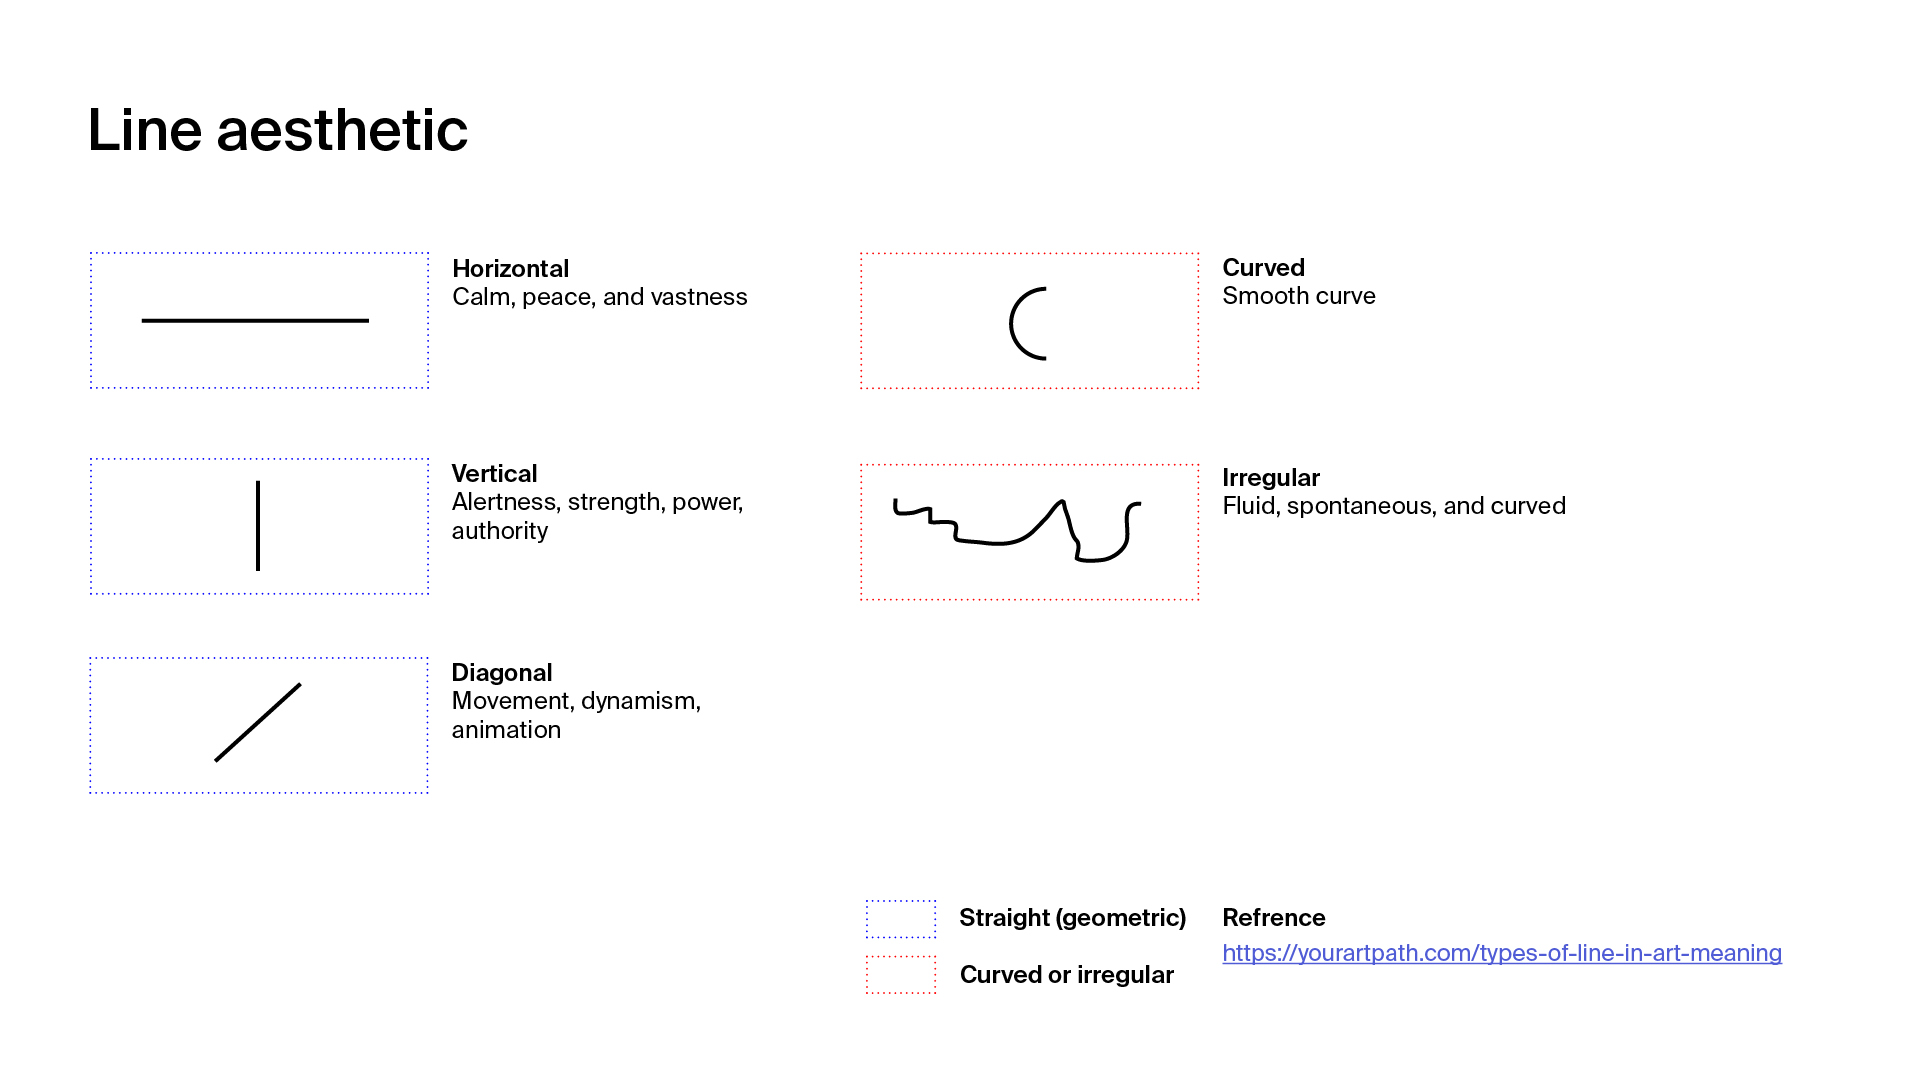
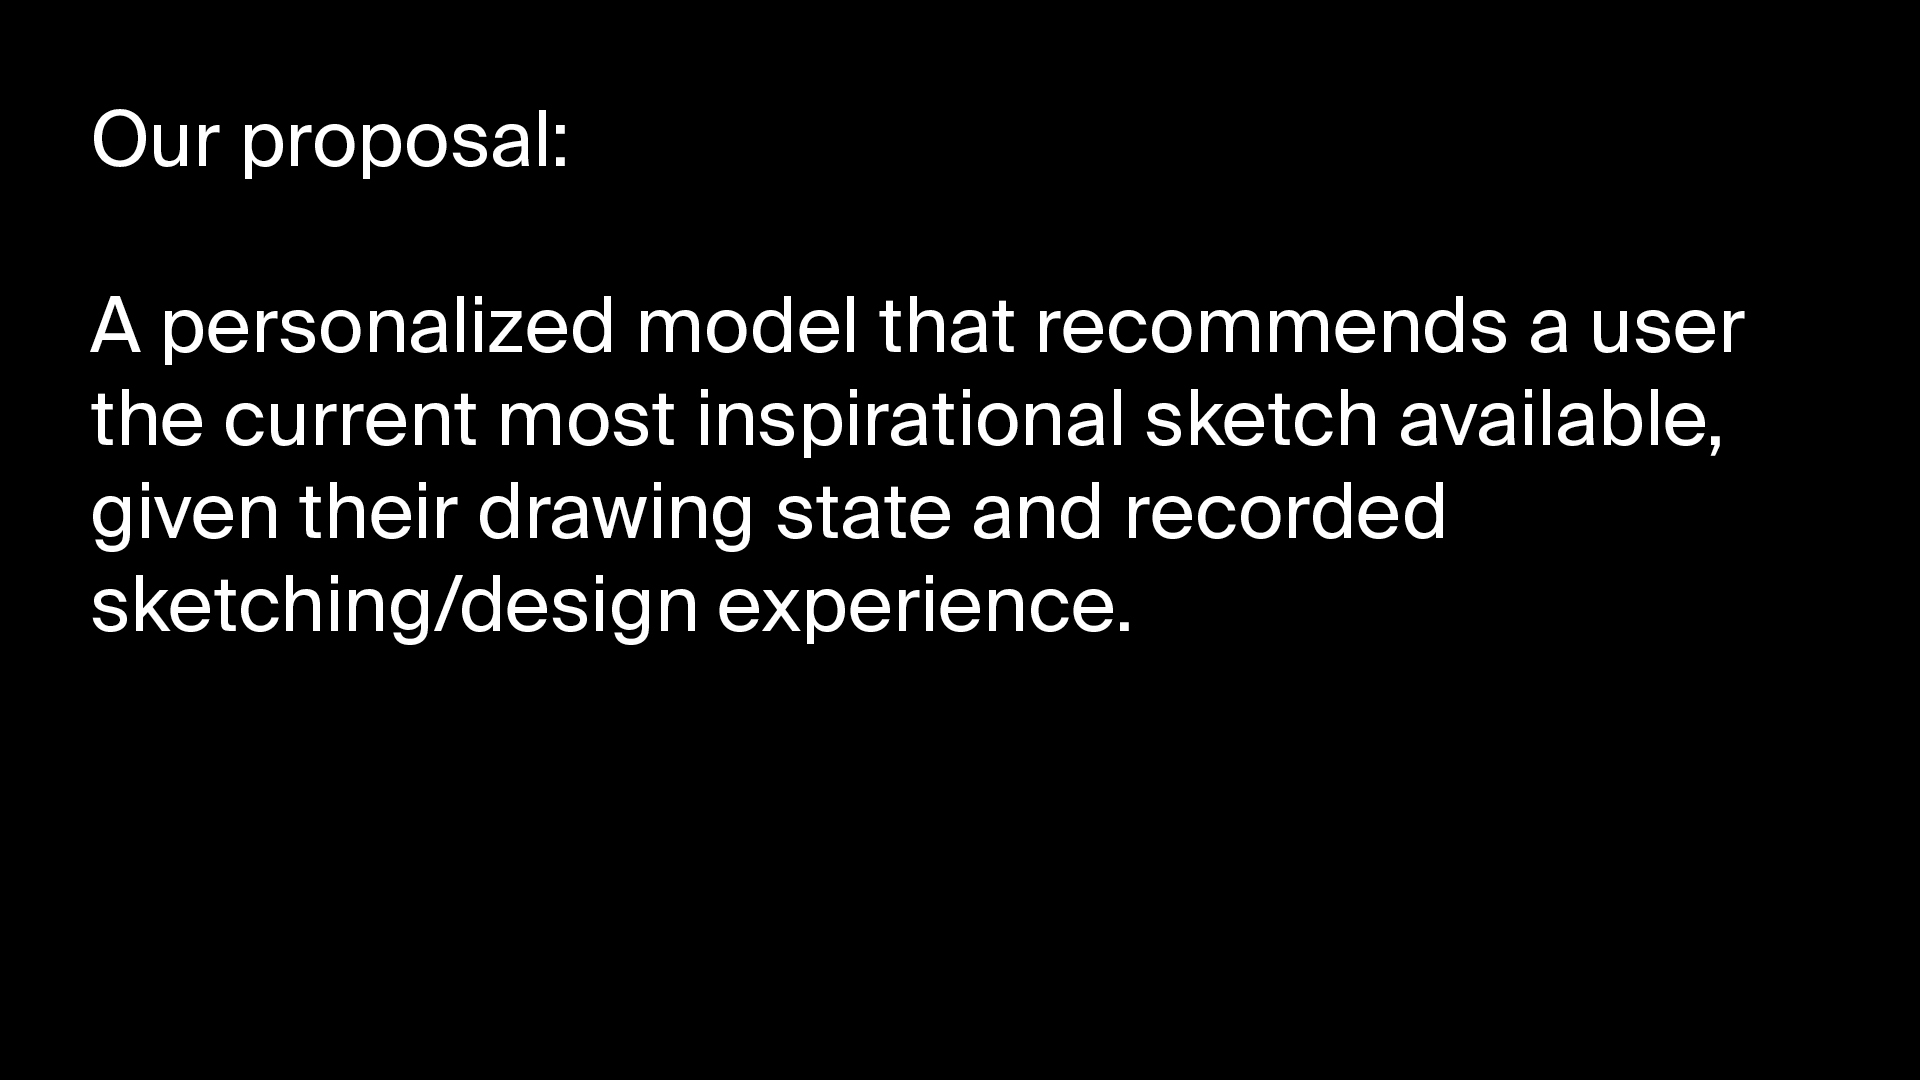
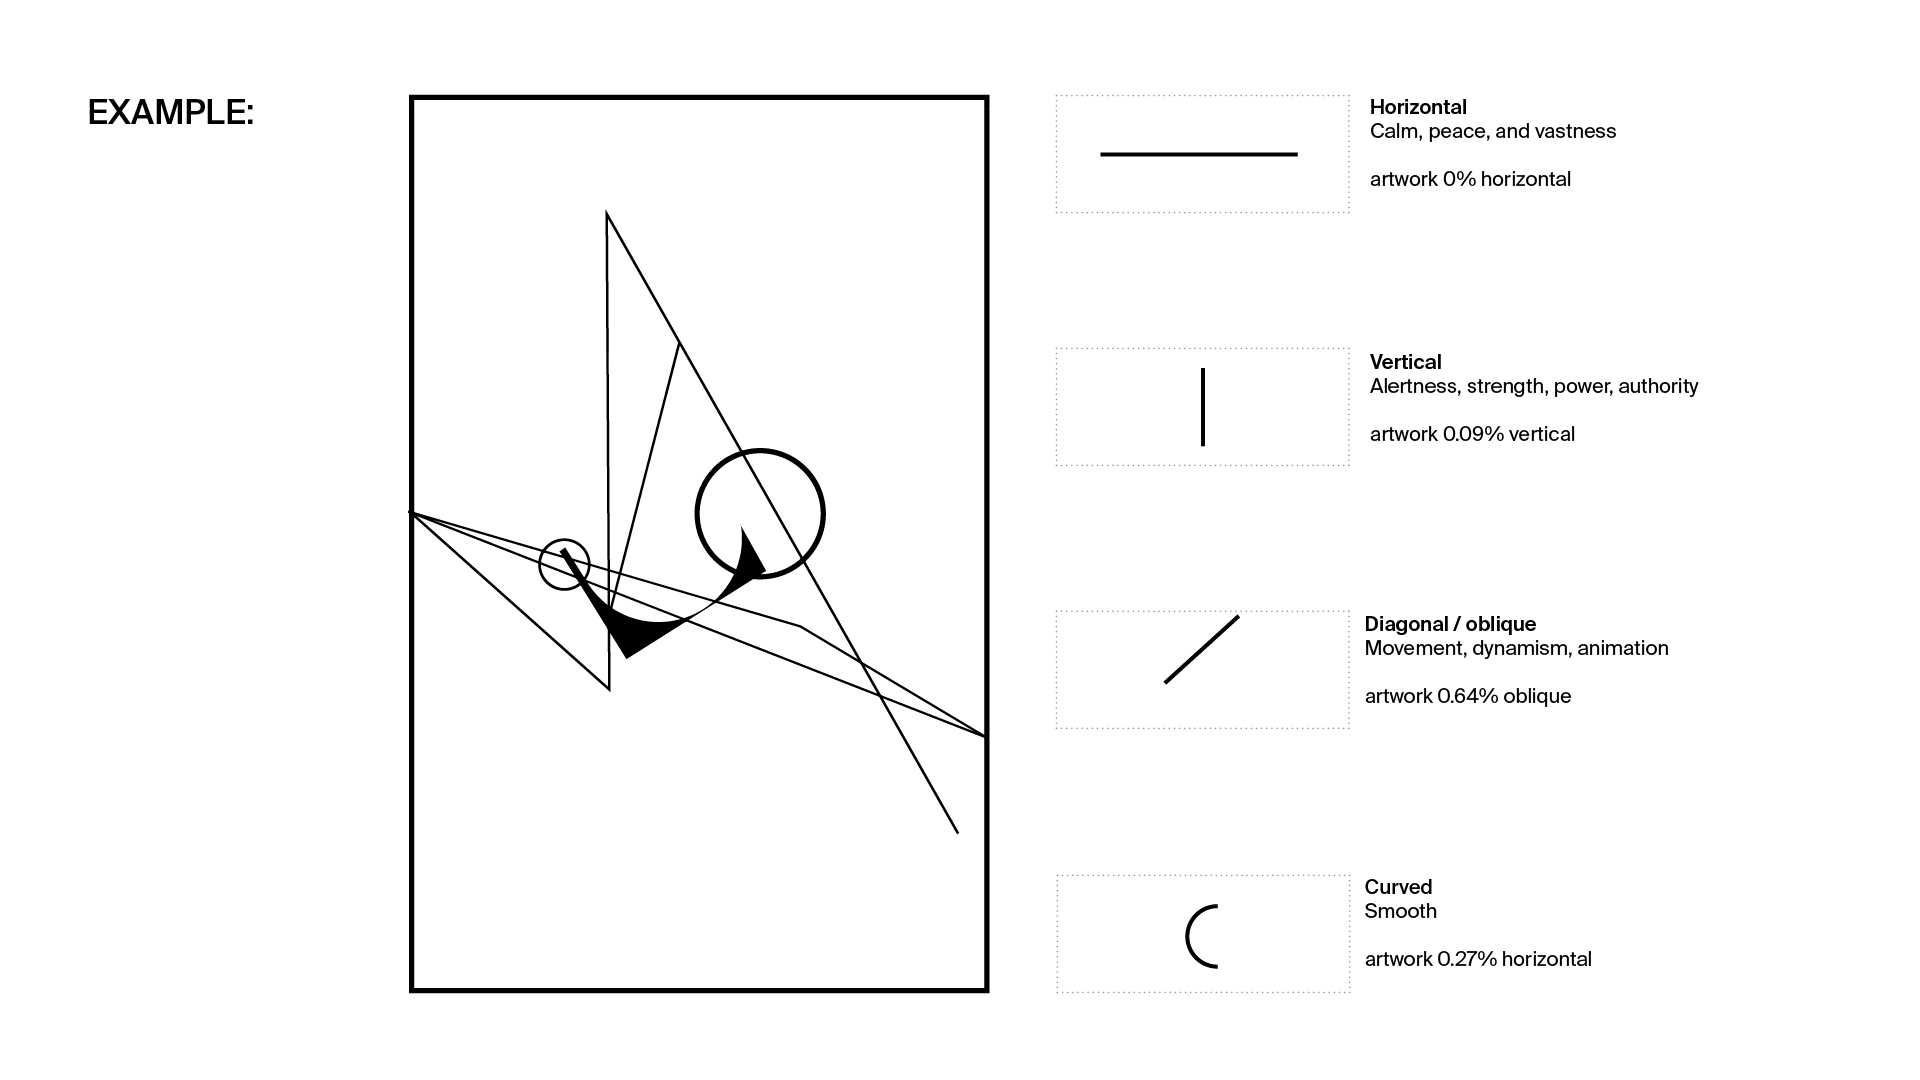
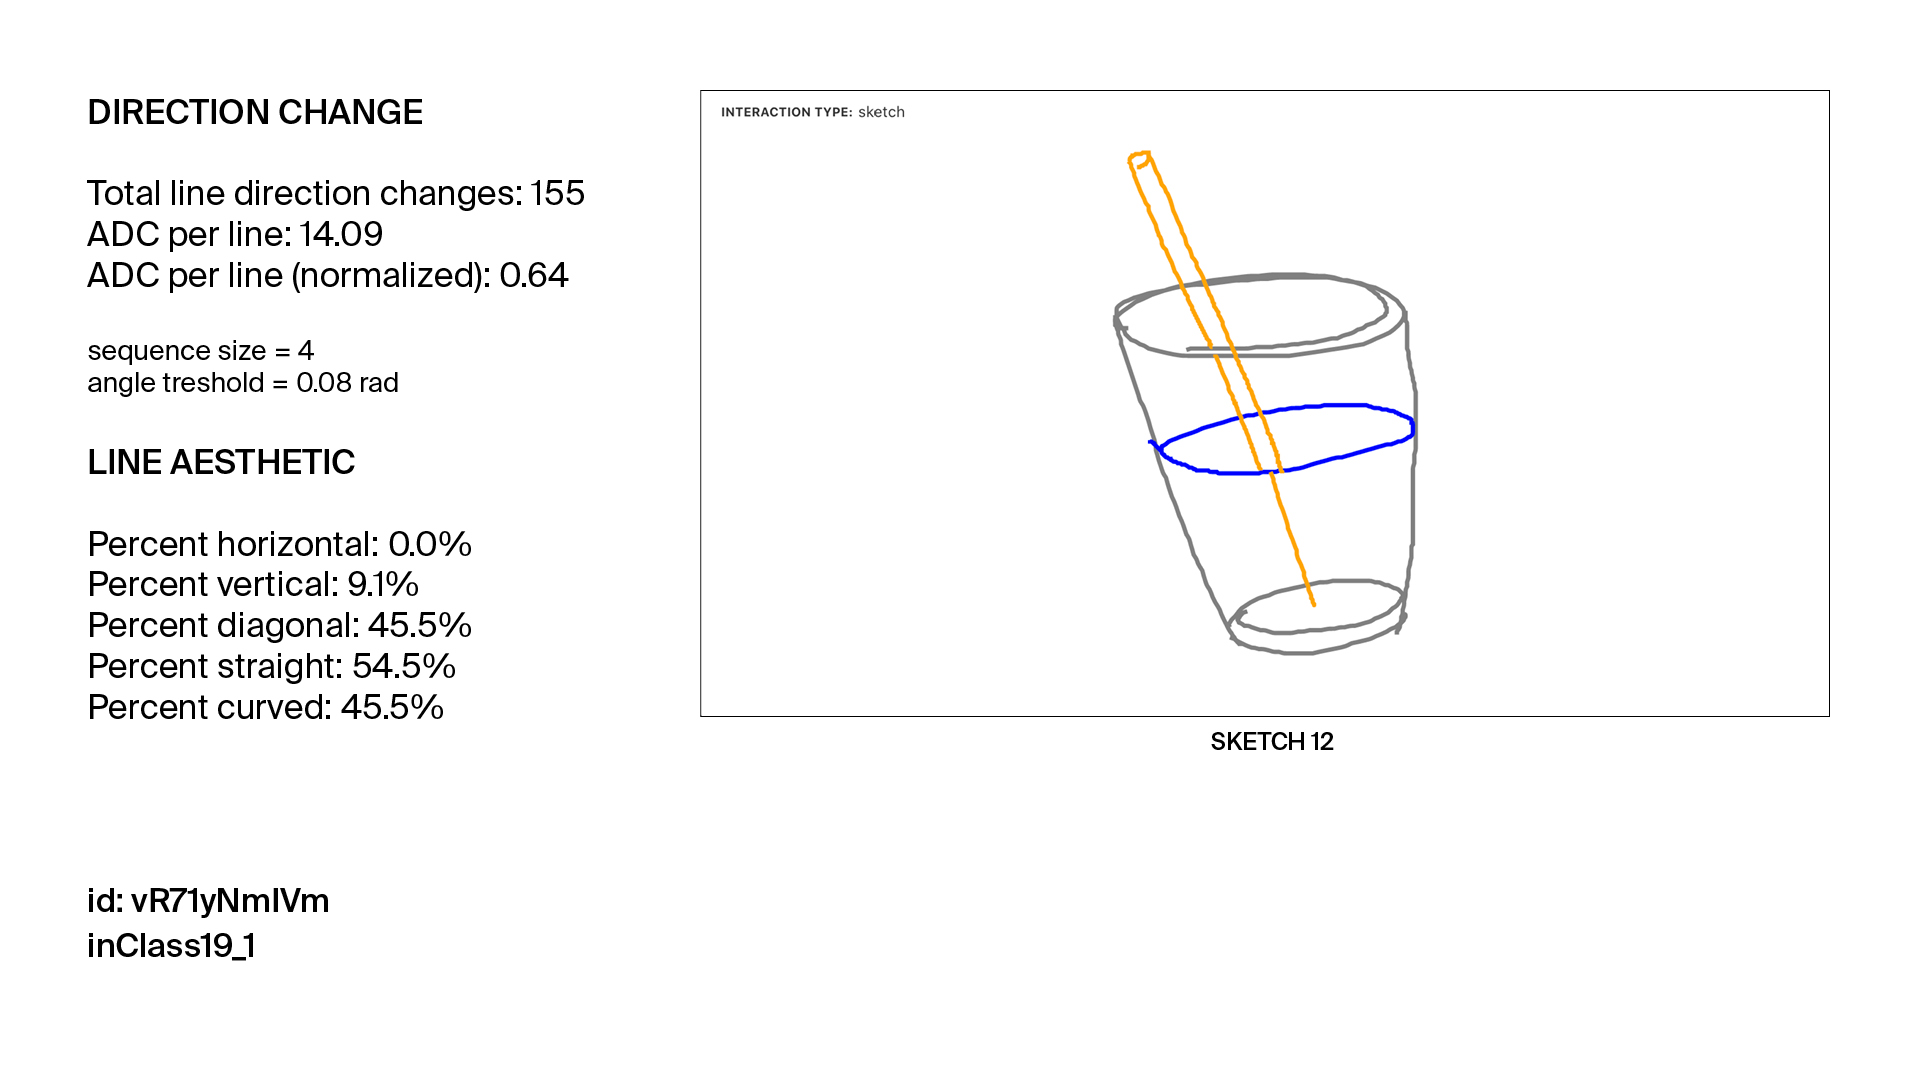
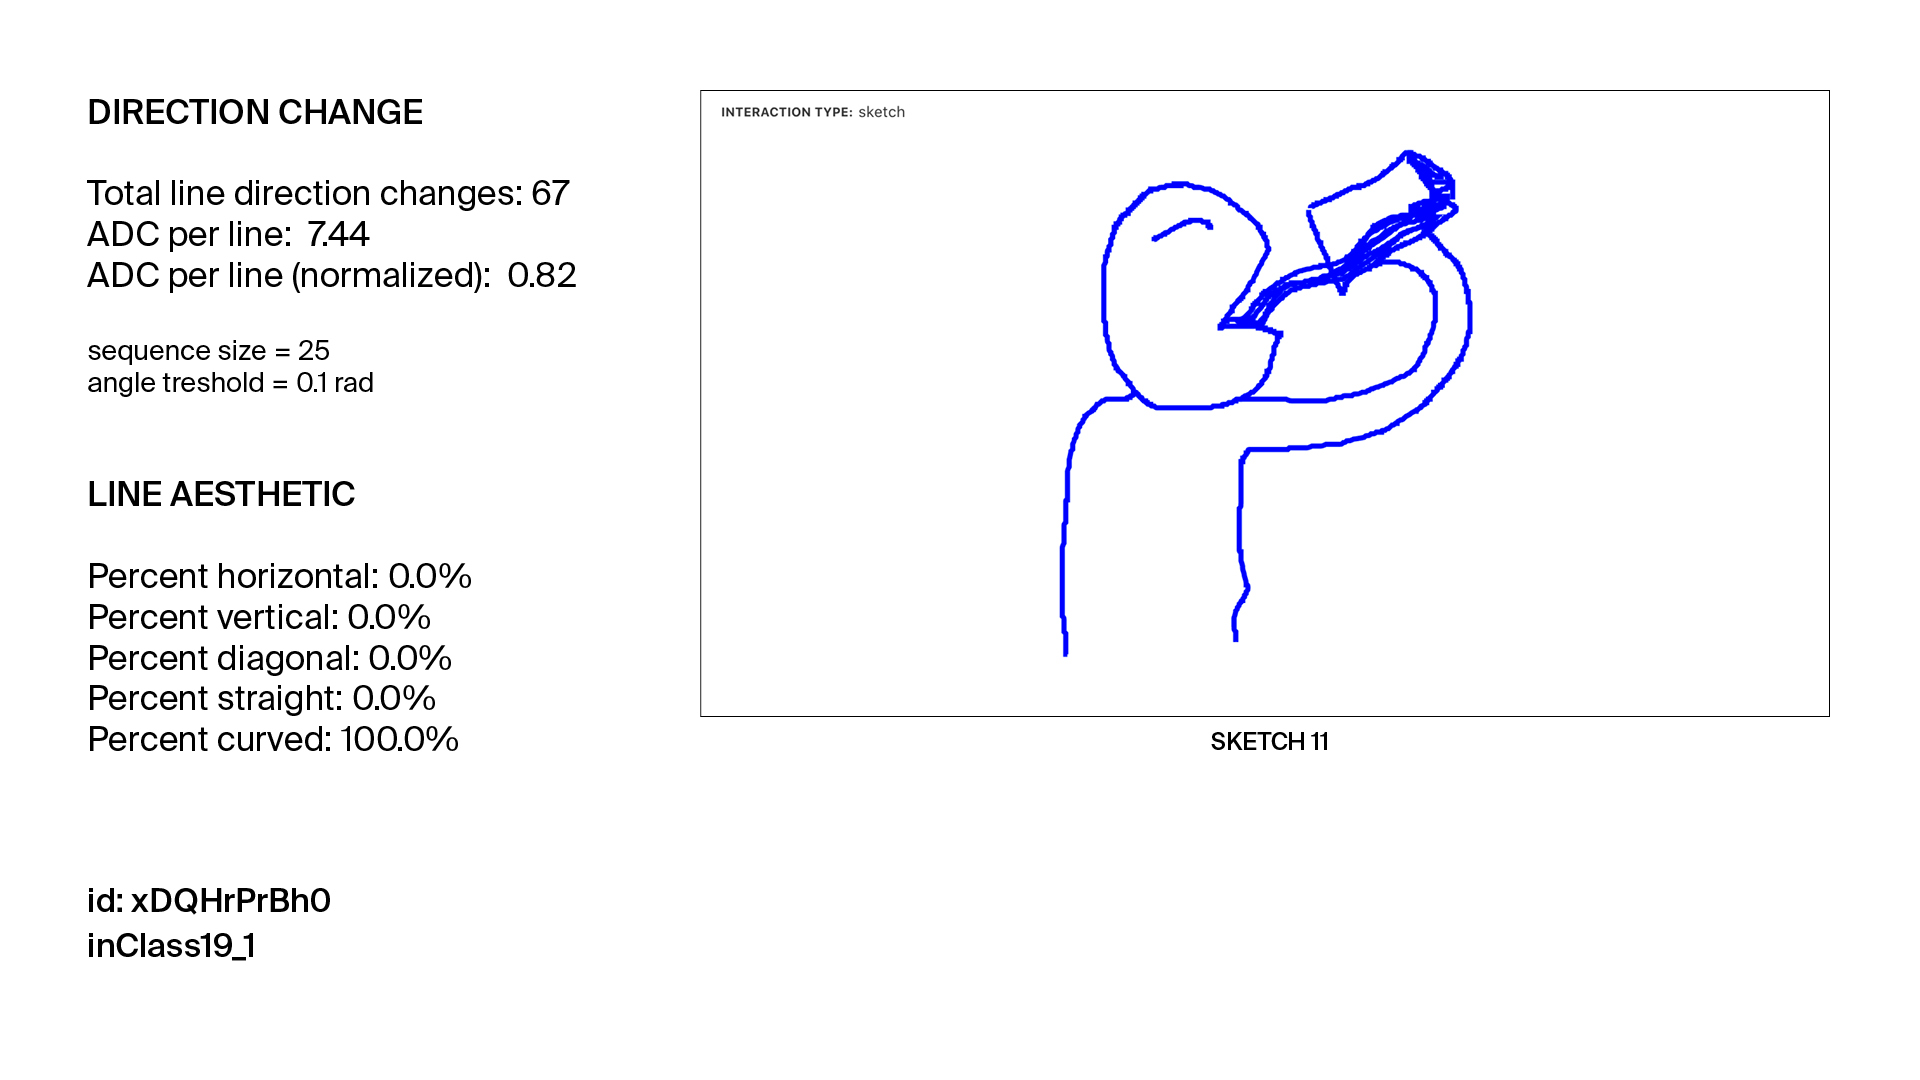
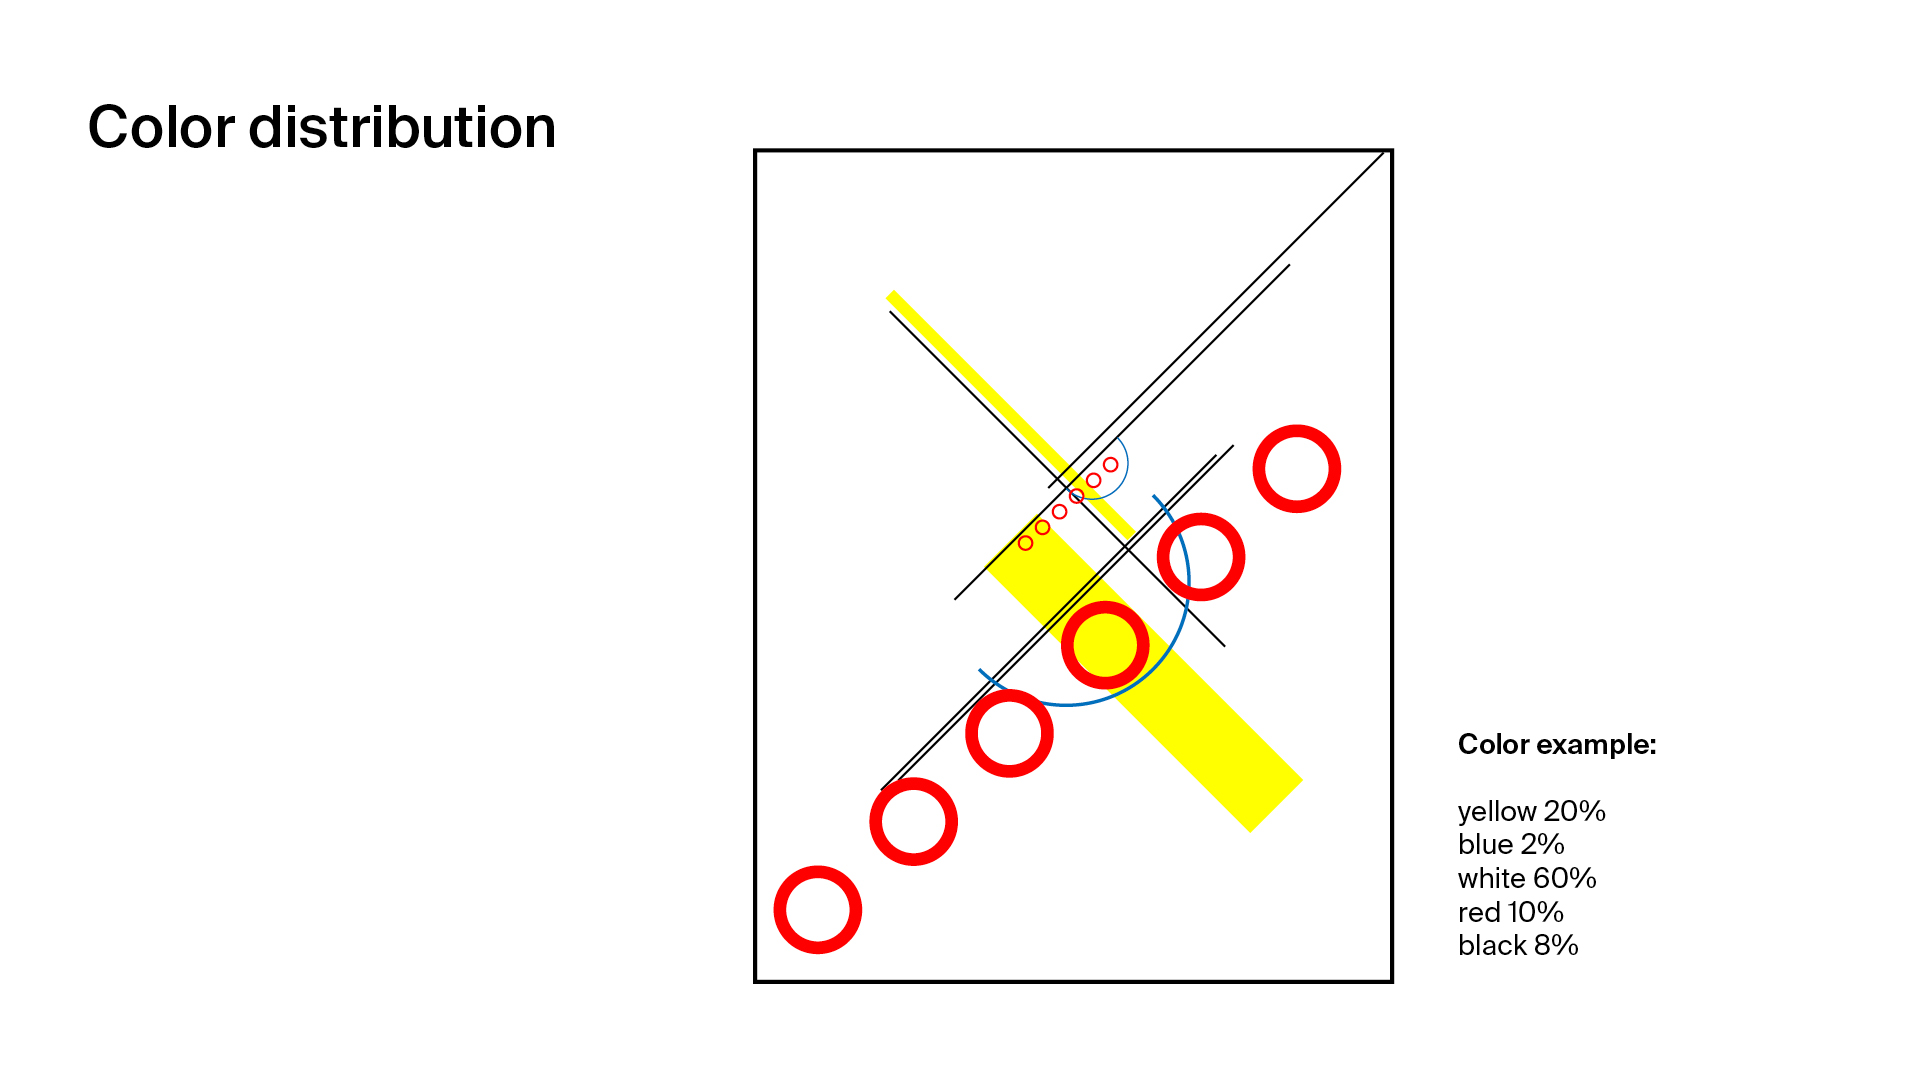
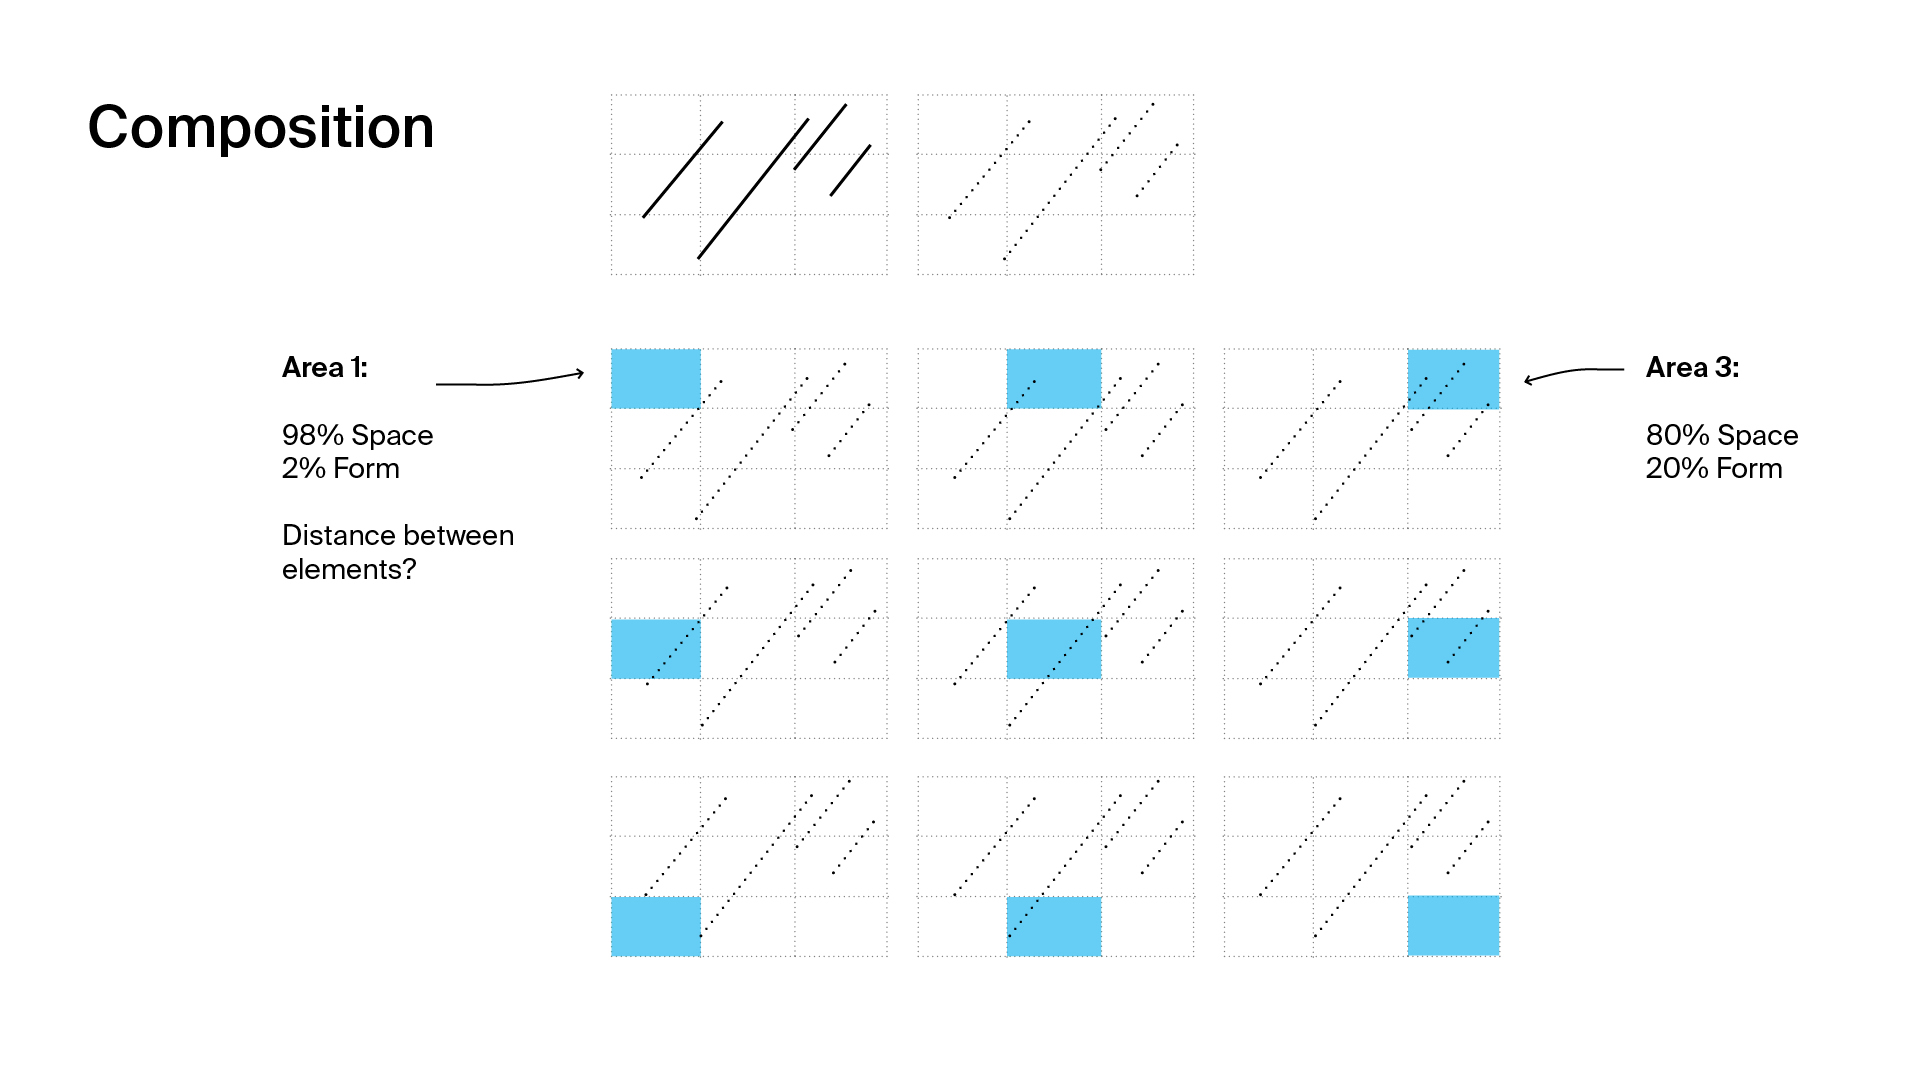
Sketchy is a web-based drawing application that allows users to sketch in virtual rooms and get ideas from viewing their peer’s sketches in real-time. In my contribution as a graduate research for the Brown University HCI Group, I conceptualized and constructed novel artistic features from 2D stroke data to help in the building of a personalisation model to support artists in their creative process. This is an on-going project. Reviewed paper for CHI 2020 conference.
Date: 2020
Client: Brown University HCI Lab
Advisor: Jeff Huang, PhD & Shawn Wallace

PREDICTING HOUSEHOLD INCOME IN NYC
The goal of this collaborative project was to use census data to create two sensible models for predicting median household income and income per capita in New York City and the surrounding area.
Two analytical approaches, Stepwise Selection and Shrinkage Methods, were used to select a subset of predictors. Using the variables selected, we performed multiple linear regression to model median household income and income per capita as a linear combination of the potential predictors. Starting from that baseline model, we added interaction terms and performed transformations on variables based on exploratory analysis and model diagnosis. Finally, an interpretation for each model was provided.
Date: 2018
Client: Self
Class: Statistical Learning, Brown University
Collaborators: Yiwen Shen and Zhiwei Zhang
Instructor: Alice Paul, PhD

SPEAKER DESIGN AND VISUALIZATION
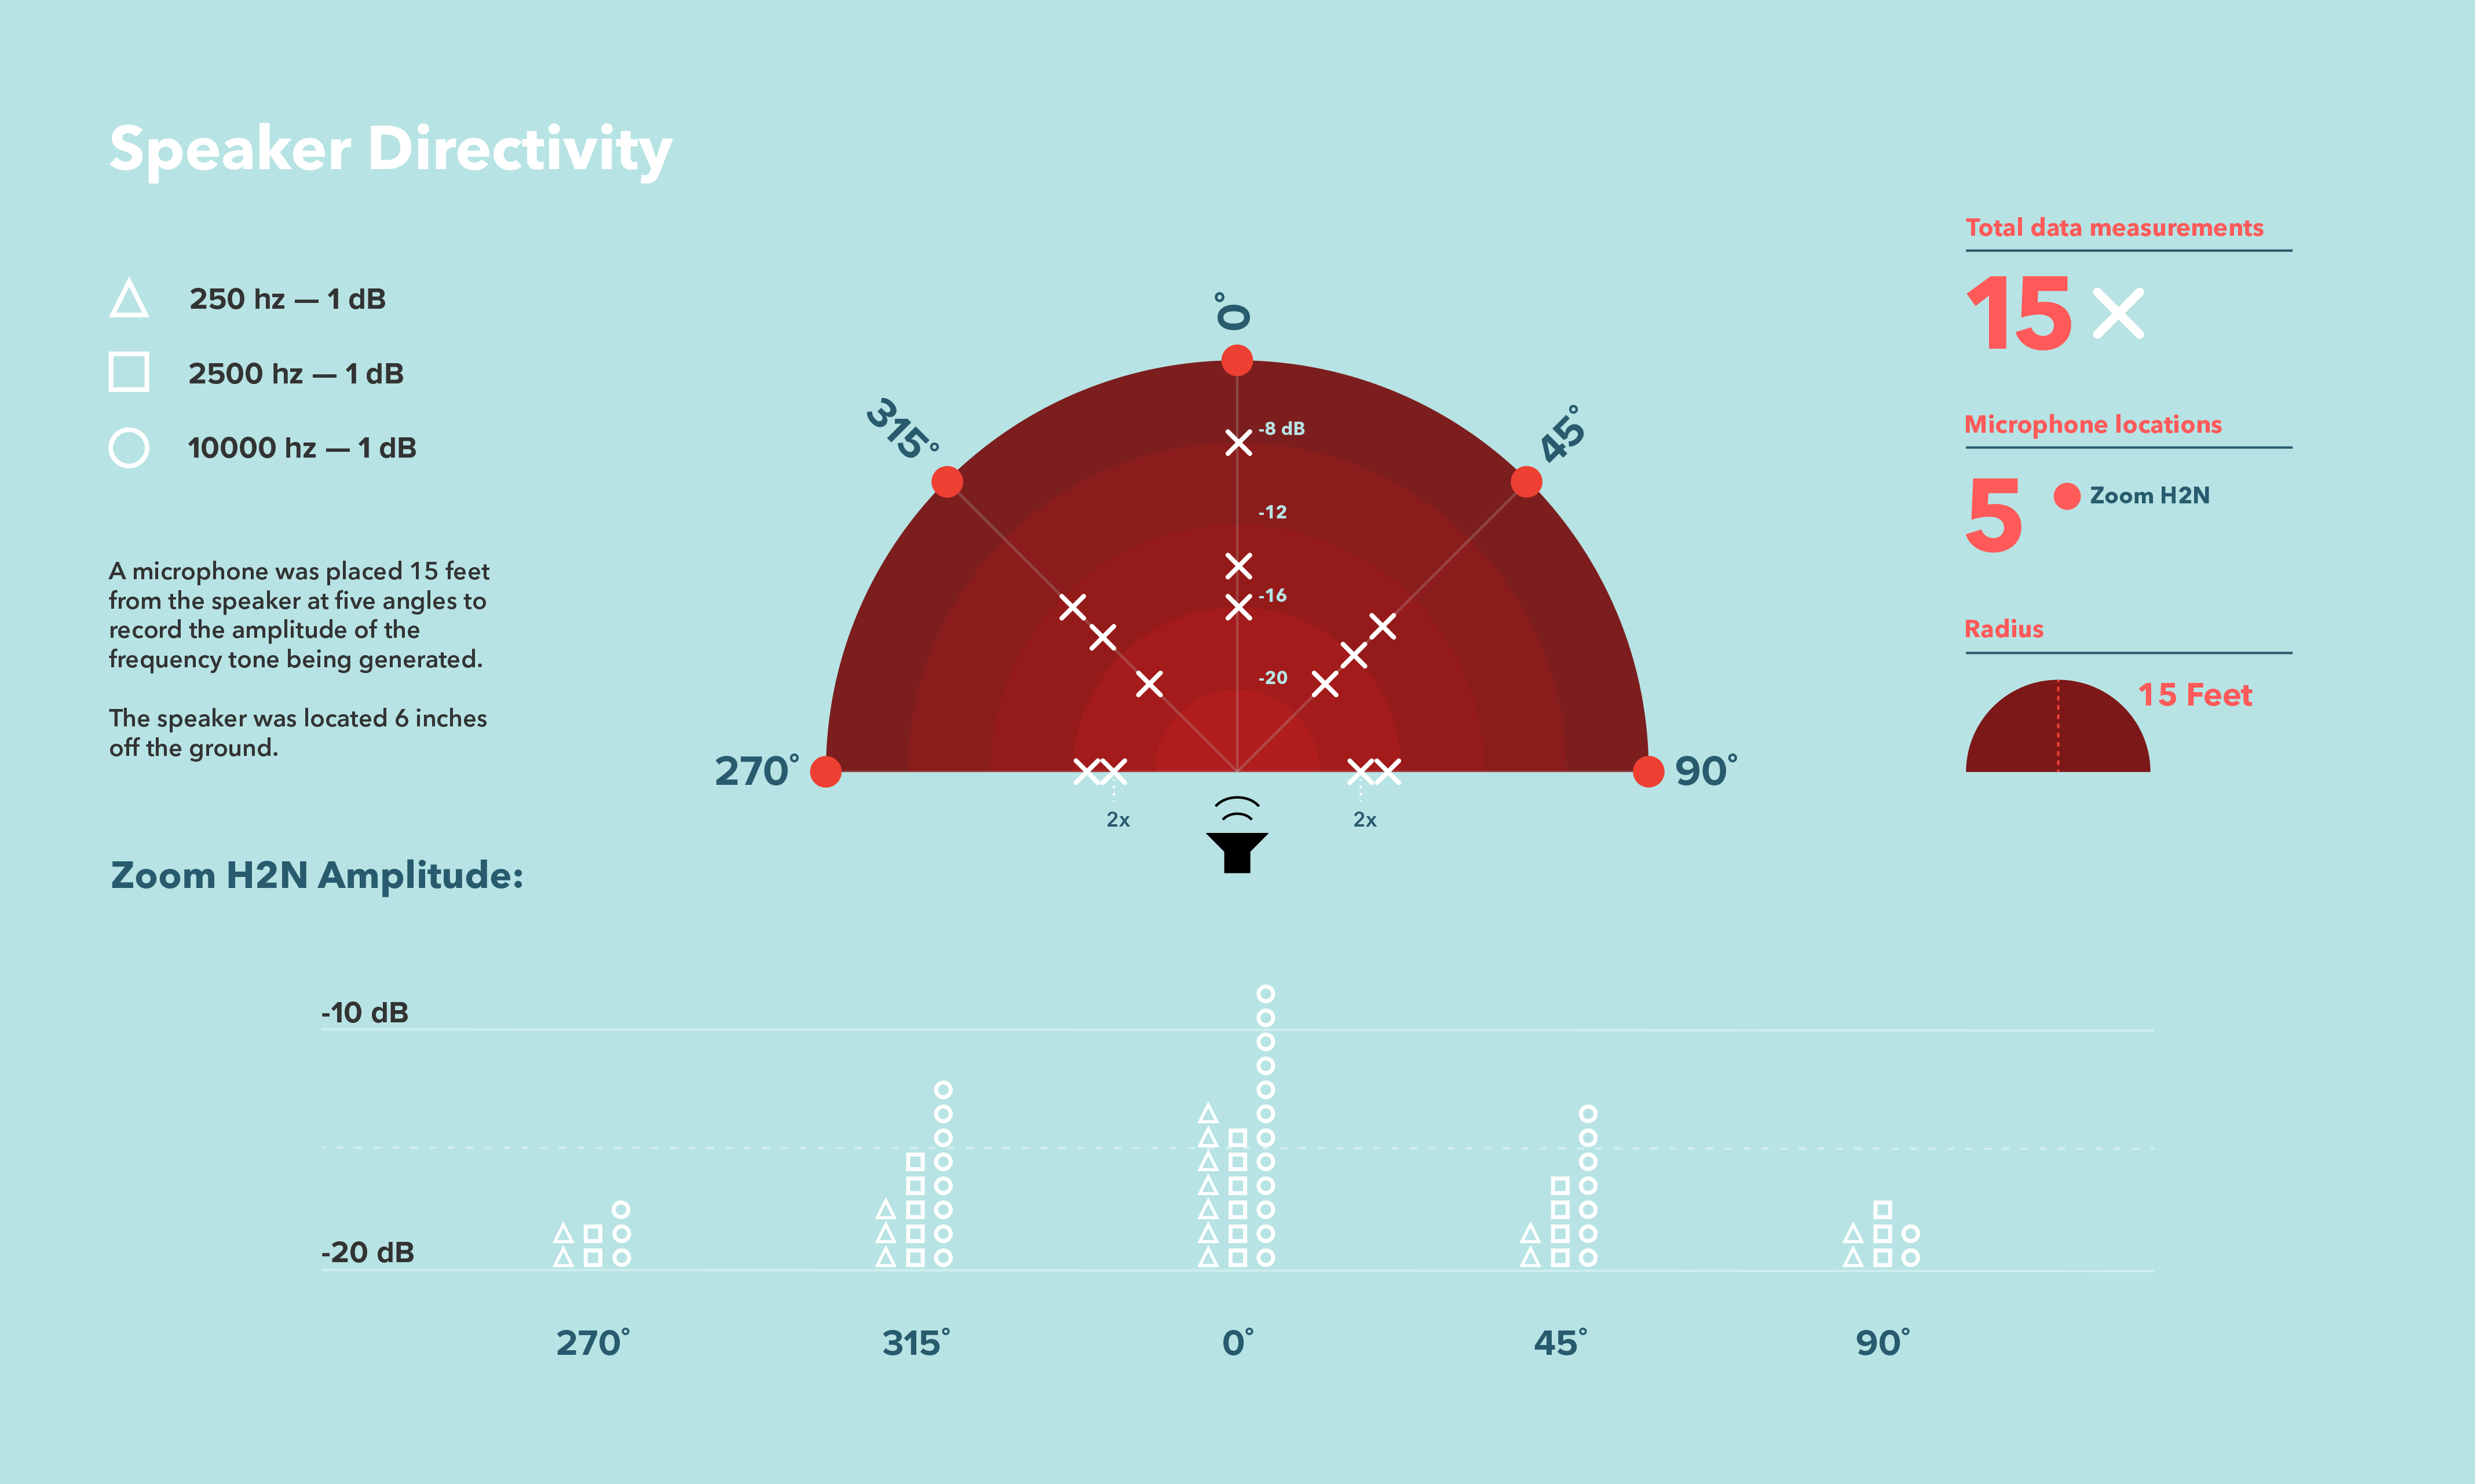
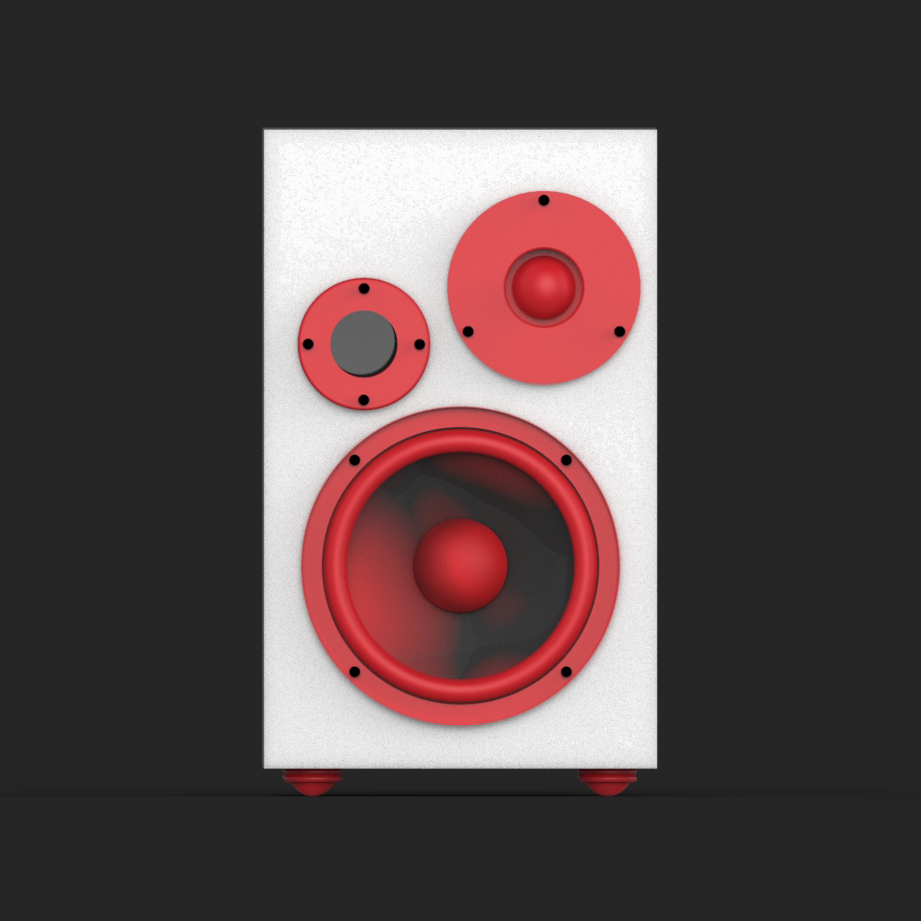
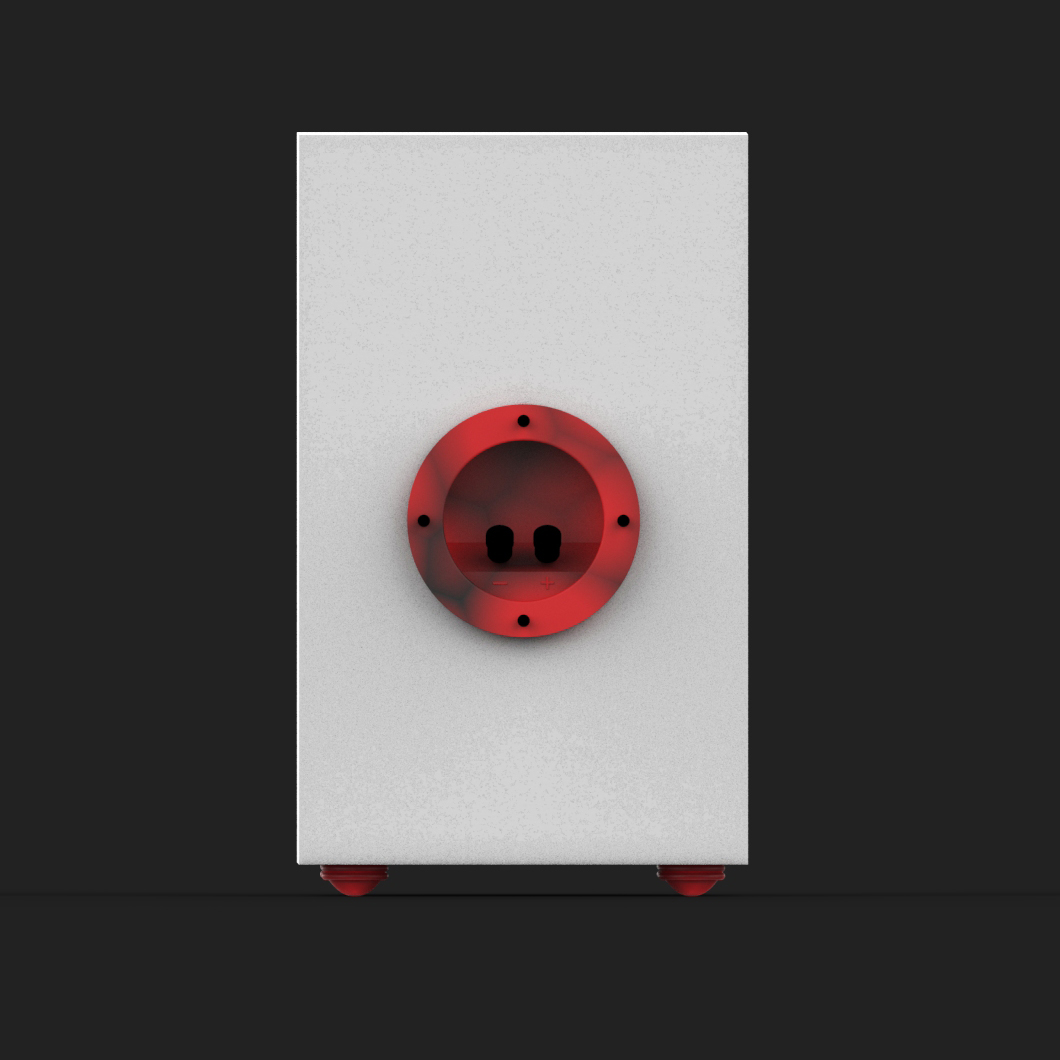
Designed a speaker from scratch and then created an experiment to test it and visualize the acoustic data. The images shown here depict my full process, including research, circuit design, modeling, fabrication, testing, and visualization.
Directivity is the measure of how directional a source is — in other words, how good the loudspeaker is of transmitting sound at a specific direction. The final performance results indicate, as expected, that the speaker is more directional at higher frequencies. Sounds were produced using a frequency tone generator source at constant amplitude and recorded at five angles using a Zoom H2N microphone.
Date: 2016
Client: Self
Collaborator: Jorge Tonelli (circuit schematic)
Class: Electroacoustic Transducers
Instructor: David Brown, PhD


PAINTING CLASSIFICATION WITH CNNS
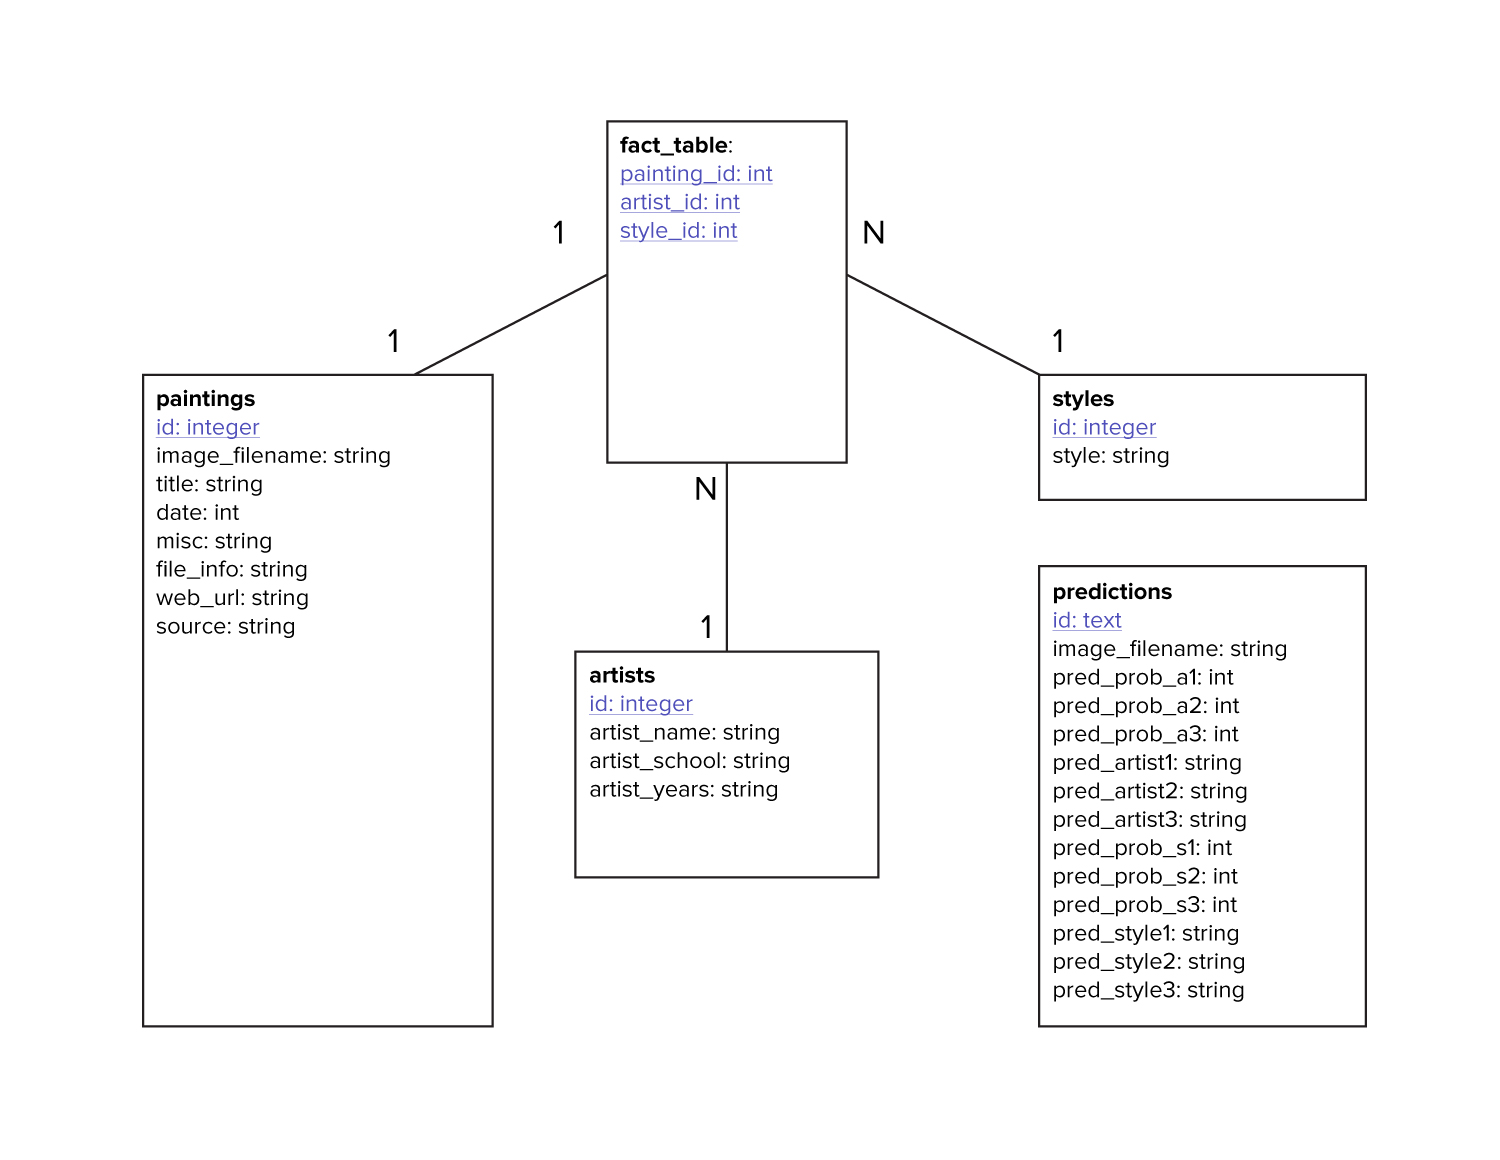
Within recent years, museums and online art collectives around the world have started to digitize their art collections. In order to help support educators, curators, and archivists to archive and find interesting correlations between artwork, I helped to design a deep learning model to help identify patterns within the paintings.
A database was formed with over 15,000 web-scraped images, each having attributes like (e.g. date and artistic style). A total 12 total artistic styles and 28 artists were represented. A convolutional neural network (CNN) was trained to predict style and artist, with a validation classification accuracy of 40% for style and 53% for artists. A simple visual interface was made to allow a user to run new (untrained) images through the model.
Client: Self
Date: 2017
Class: Data and Computational Science
Instructor: Dan Potter, PhD
Data Science, Deep Learning
![]()
→ Data acquisition and storage
→ Status update
→ Final ML
→ Interactions and summary
→ Data acquisition and storage
→ Status update
→ Final ML
→ Interactions and summary
SLICE OF LIFE
Designed a data visualization telling the story of three personal trips: from my RISD room to the RISD Design Center, from my RISD room to home, and from my RISD room to Iceland.
Date: 2016
Client: Self
Class: Information Design (RISD)
Instructor: Doug Scott
Designed a data visualization telling the story of three personal trips: from my RISD room to the RISD Design Center, from my RISD room to home, and from my RISD room to Iceland.
Date: 2016
Client: Self
Class: Information Design (RISD)
Instructor: Doug Scott
︎Information design
![]()

FORCE AND POSITION MIDI CONTROLLER
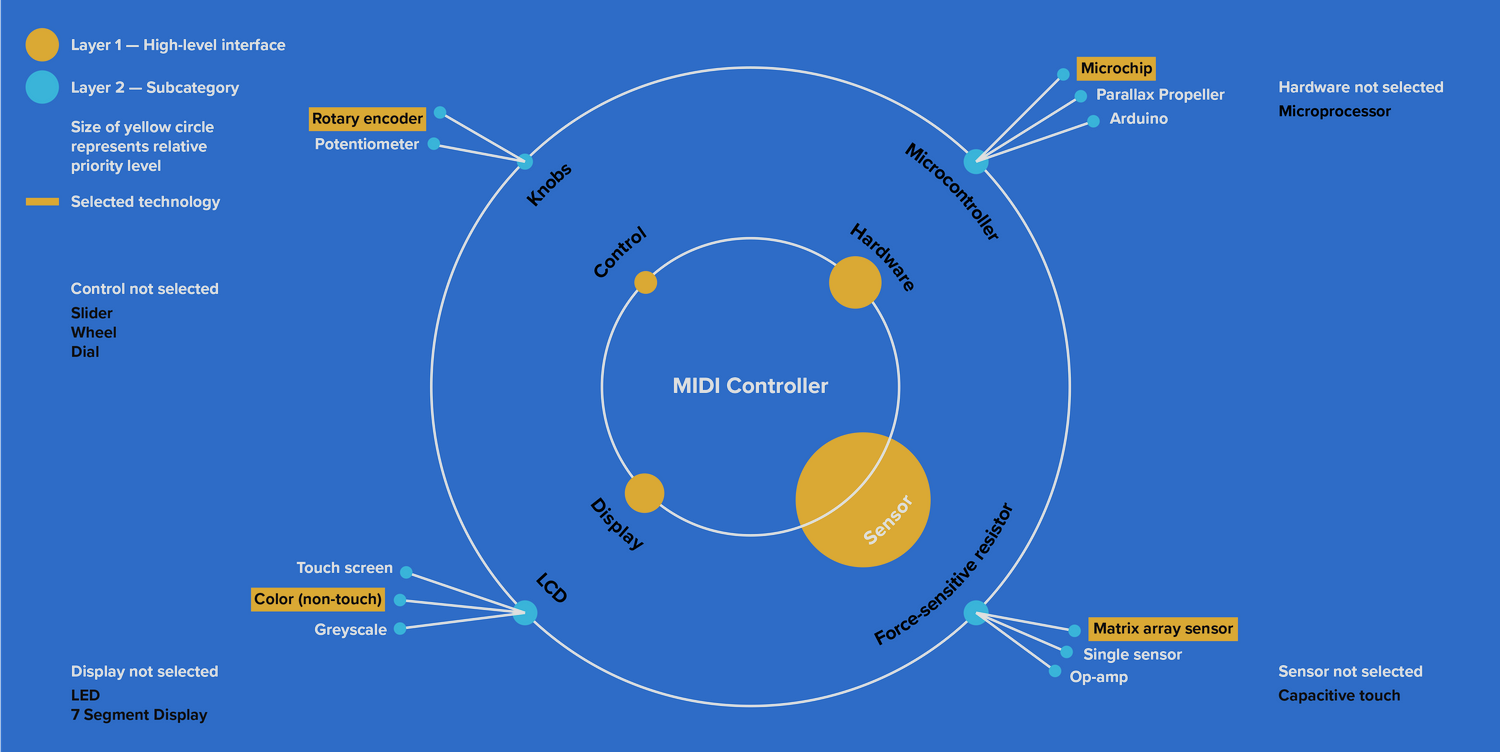
Led a team of five other engineering students to design a highly customizable position and force sensing MIDI (Musical Instrument Digital Interface) controller prototype for a small synth repair company based in Southern Maine called New England Analog.
Date: 2014
Client: New England Analog
Class: Electrical Enginnering Senior Capstone
Collaborators: Cameron Connor, Jean Pierre, Aaron
DaPonte, Greg Ladd, Devin Honeycutt
Advisors: David Rancour, PhD and Howard Michel, PhD
RACIAL BIAS IN POLICE KILLINGS
The goal of this project was to develop a better understanding of the factors that affect racial bias in police shootings in the United States.
To do this, I developed several multi-level machine learning models uding aggregated police data and studied the effect of the features on the outcome variable (race). The report includes initial data preprocessing and aggregation, exploratory analysis, modeling building, model selection, and model interpretation. Finally, I summarize my results and provide an analysis of the larger ethical implications surrounding the research.
Client: Self
Date: 2018
Class: Statistical Learning
Instructor: Alice Paul (PhD), Operations Research